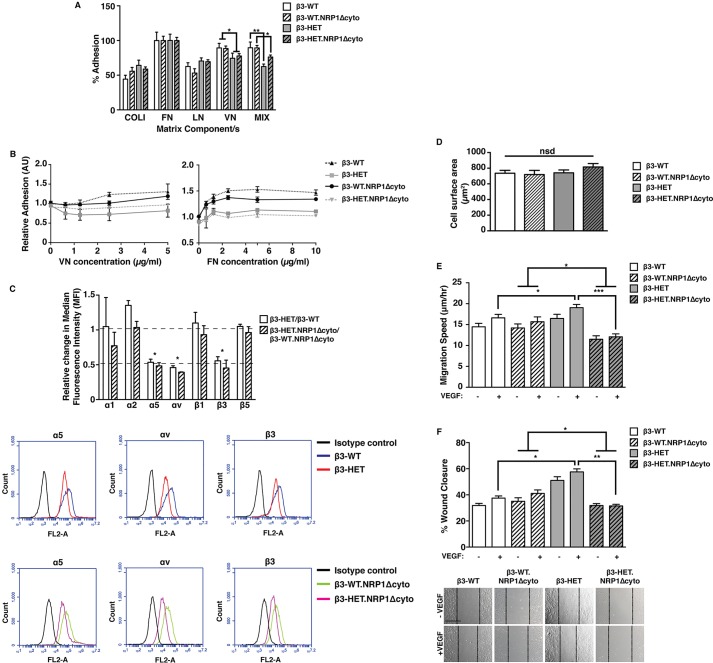
Fig. 3.
VEGF-induced migration in β3-integrin-heterozygous endothelial cells is dependent on NRP1. (A) ECs isolated from animals of the four indicated genotypes were seeded on collagen type I (COLI), fibronectin (FN), laminin (LN), vitronectin (VN), or a complex mixture of COLI, FN, VN and gelatin (MIX) for 90 min. Unattached cells were gently washed off, and the remaining cells were fixed and stained. Dye was extracted and measured spectophotometrically. The bar chart shows the percentage of cell adhesion to each component relative to FN (means+s.e.m. from three independent experiments). (B) ECs of the indicated genotypes were plated on increasing concentrations of FN or VN. After 90 min, plates were vigorously washed and remaining cells were fixed and stained. Dye was extracted and measured spectophotometrically. The graph shows the mean (±s.e.m. from ≥two independent experiments) number of cells that remained attached to the plate after the procedure. (C) ECs of the indicated genotypes were measured for their surface expression of endothelial integrin subunits by flow cytometry. Median fluorescence intensity (MFI) was measured after forward versus side scatter data were tightly gated around, and normalised to, an isotype control. The bar chart shows the relative change in MFI of β3-HET compared to β3-WT ECs, or of β3-HET.NRP1Δcyto ECs compared to β3-WT.NRP1Δcyto ECs (means+s.e.m. from three independent experiments). Relative changes were deemed significant with a twofold change. Representative flow-cytometric histogram profiles are shown below for significantly changed integrins. (D) 70×105 cells of the indicated genotypes were plated for 6 h on 10 μg/ml FN in six-well plates. Phase-contrast photographs were taken and cell surface areas were measured using ImageJ™ software. The bar chart represents mean (+s.e.m.) surface area quantified from multiple images (n≥50 cells per genotype). (E) ECs were firmly attached to FN-coated dishes and then imaged live for 15 h in low-serum medium ±VEGF. Individual cells were tracked every 10 min over this period using ImageJ™. The bar chart shows the EC migration speed of each of the indicated genotypes (mean+s.e.m. from three independent experiments; n=50 cells per condition). (F) ECs were plated onto FN-coated dishes overnight. After 3 h of starvation, a scratch wound was created and cells were incubated in low-serum medium ±VEGF for 24 h. The bar chart shows the percentage closure of the scratch ‘wound’ as a result of directed cell migration (means+s.e.m. from three independent experiments; n=27 for each condition). Representative images of scratch-wound closure at 24 h are shown below. Scale bar: 200 μm. Asterisks indicate statistical significance: *P<0.05; **P<0.01; ***P<0.001; nsd, not significantly different. Unpaired two-tailed t-test.

