Fig. 4.
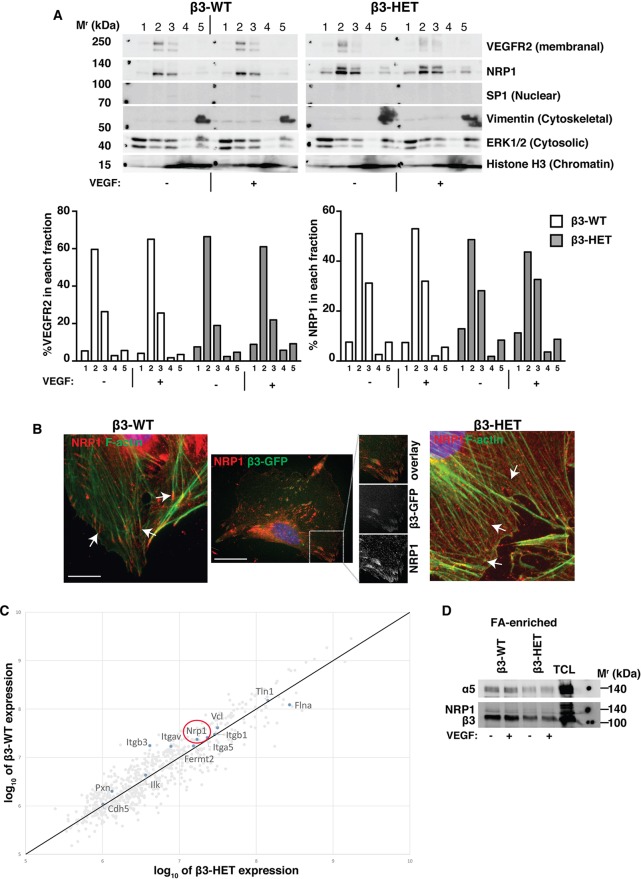
NRP1's localisation in focal adhesions is altered in β3-integrin-heterozygous endothelial cells. (A) β3-WT and β3-HET ECs were subjected to a cell-fractionation experiment following ±VEGF treatment for 10 min. Fractionated samples were then analysed by western blot for the indicated proteins. 1=cytoplasmic extract; 2=membrane extract; 3=soluble nuclear extract; 4=chromatin-bound nuclear extract; 5=cytoskeletal extract. Protein markers for each subcellular compartment were included as controls. Data are representative of two independent experiments. The bar charts represent the relative proportion (%) of VEGFR2 or NRP1 present in each fraction determined by ImageJ™ densitometry. (B) Left and right panels: β3-WT and β3-HET ECs were seeded overnight onto FN-coated glass coverslips and then stimulated with VEGF for 10 min. Cells were fixed and stained with phalloidin for filamentous actin (F-actin; green), and immunostained for neuropilin-1 (NRP1; red). Arrows point to the ends of actin filaments. Middle panel: β3-WT ECs were transfected with a β3-integrin-GFP construct (green) and seeded on FN-coated coverslips. 48 h later, cells were fixed and immunostained for NRP1 (red). Split-channel close-ups are shown to depict β3-integrin/NRP1 colocalisation. Scale bars: 10 μm (middle), or 20 μm. (C) ECs were allowed to adhere to FN-coated dishes for 90 min to establish ‘mature’ integrin-dependent focal adhesions (FAs). FAs were chemically cross-linked to the plates and cells were lysed with RIPA buffer. Non-cross-linked proteins and other cellular components were rinsed away under high-sheer flow. FA-enriched complexes were eluted, subjected to SDS-PAGE and then analysed by label-free, quantitative mass spectometry. The graphs represent log ratio plots of the proteomic data comparing unstimulated β3-WT ECs (y-axis) and β3-HET ECs (x-axis). Proteins above the diagonal line are higher in β3-WT ECs, whereas those below the line are higher in β3-HET ECs (n=3 samples per genotype). NRP1 is present in both adhesomes (red circle). (D) FA-enriched EC samples were processed as in C and then analysed by western blot for the indicated proteins. A total cell lysate (TCL) is shown for comparison. Data are representative of three independent experiments.

