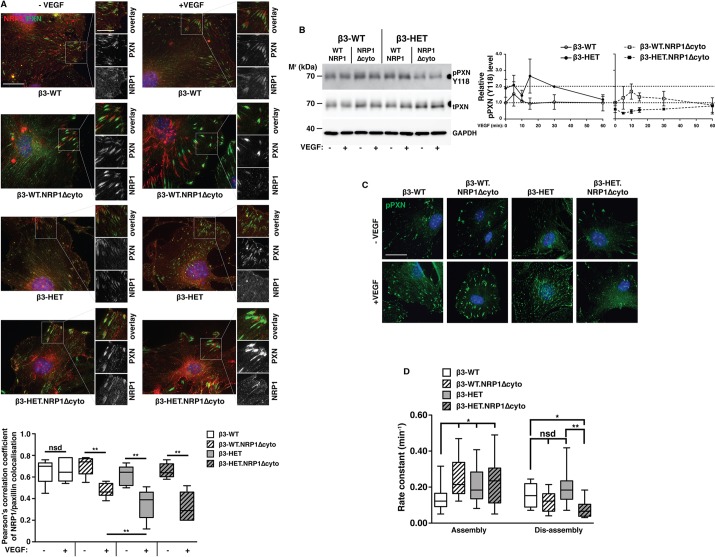
Fig. 5.
Paxillin activation and focal adhesion disassembly are sensitive to NRP1 disruption in β3-integrin-heterozygous endothelial cells. (A) ECs of the indicated genotypes were seeded overnight on FN-coated glass coverslips. After 3 h of starvation, cells were treated ±VEGF for 10 min in serum-free medium, then fixed and immunostained for total paxillin (PXN; green) and neuropilin-1 (NRP1; red). Split-channel close-ups are shown to depict PXN/NRP1 colocalisation. Scale bar: 20 μm. The box and whisker plot shows Pearson's correlation coefficient of PXN/NRP1 colocalisation in each of the indicated genotypes in the indicated regions as determined using the ImageJ™ coloc2 plugin (means±interquartile ranges and extreme values; n≥5 cells per genotype, over ≥three independent experiments). (B) Left panel: ECs of the indicated genotype were seeded overnight on FN. They were then starved for 3 h and treated ±VEGF for 10 min in serum-free medium. Cells were lysed and western blotted (WB) for levels of phosphorylated (p) and total (t) PXN. GAPDH served as a loading control. Data are representative of three independent experiments. Right panel: the graph shows densitometry of pPXN relative to tPXN, as determined by WB, over an extended VEGF time course (means±s.e.m. from ≥three independent experiments). (C) ECs were seeded overnight onto FN-coated glass coverslips and stained for pPXN. ECs were starved for 3 h and treated ±VEGF for 10 min in serum-free medium. Cells were fixed and immunostained for pPXN (green). Scale bar: 10 μm. (D) ECs were transfected with a PXN-GFP construct and seeded at a low density on FN-coated coverslips. 72 h later, cells were starved and then treated with VEGF in reduced-serum medium. Representative cells were then imaged live (every 2 min) on an inverted fluorescence microscope for 1 h to monitor focal adhesion (FA) remodelling. The front and back ends of individual FAs were tracked over this period to measure FA assembly and disassembly, using the ImageJ™ MTrack2 plugin. The box and whisker plot shows the rate of FA assembly or disassembly for each of the indicated genotypes (means±interquartile ranges and extreme values; n≥20 FAs per genotype, from ≥two independent experiments). Asterisks indicate statistical significance: *P<0.05; **P<0.01; nsd, not significantly different. Unpaired two-tailed t-test.

