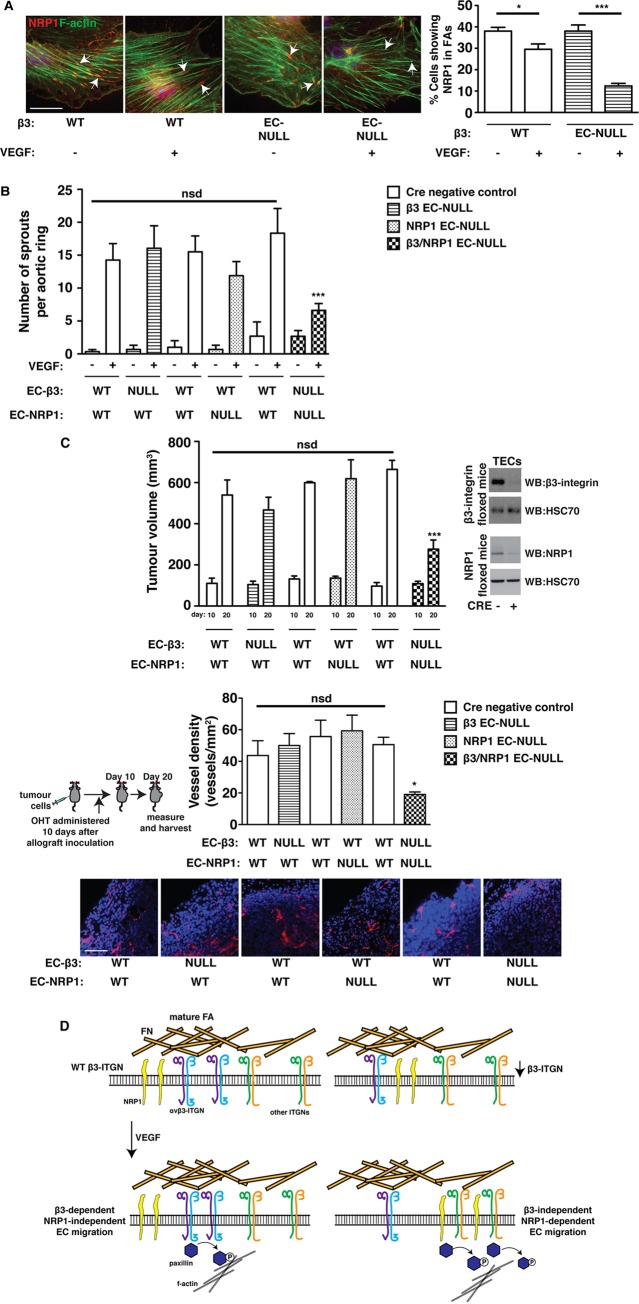
Fig. 6.
Simultaneously depleting both β3-integrin and NRP1 blocks growth and angiogenesis in already-established tumours. (A) Primary lung microvascular ECs were isolated from β3-floxed-Pdgfb-iCreERT2-negative and -positive animals. Tamoxifen (OHT) was administered after pure EC populations were achieved. Cells were then plated overnight on FN-coated glass coverslips. Cells were starved for 3 h and then treated ±VEGF for 10 min in serum-free medium. Cells were fixed and stained with phalloidin for F-actin (green), and immunostained for NRP1 (red). White arrows point to the ends of actin filaments. Scale bar: 20 μm. The bar chart shows the percentage of cells within the population showing NRP1 staining at the end of actin filaments (mean+s.e.m.; n≥50 cells per condition). (B) Microvessel sprouting of aortic ring explants of the indicated genotypes. Protein knockout in ECs was induced in culture with 1 μM OHT 4 days after VEGF-induced sprouting had been established. The bar chart shows the total number of microvessel sprouts per aortic ring after an additional 4 days of VEGF-stimulation (mean+s.e.m. from three independent experiments; n≥40 rings per genotype). (C) Tumour growth and angiogenesis were measured in animals of the indicated genotypes. Mice were injected subcutaneously with CMT19T cells and 10 days later OHT was administered. After an additional 10 days (20 days in total) tumours were harvested. Upper panel: the bar chart shows mean tumour volumes measured at days 10 and 20 (+s.e.m. of two or more independent experiments; n≥10 animals per genotype). The western blot to the right shows representative depletion of β3-integrin and NRP1 in tumour endothelial cells (TECs) isolated from Cre-positive animals, compared to Cre-negative littermate controls. Bottom panel: blood-vessel density in 20-day tumours was assessed by counting the total number of endomucin-positive vessels around the periphery (within 150 μm of the edge of the tumour) of midline bisected tumour sections. The bar chart shows mean vessel number per mm2 (+s.e.m.). Representative micrographs of endomucin staining (red) are shown below. Scale bar: 50 μm. Asterisks indicate statistical significance: *P<0.05; ***P<0.001; nsd, not significantly different. Unpaired two-tailed t-test. (D) Schematic representation of the hypothesised participation of NRP1 in focal adhesion (FA) remodelling and migration in β3-WT (left) and β3-suppressed (right) ECs. ITGN, integrin.

