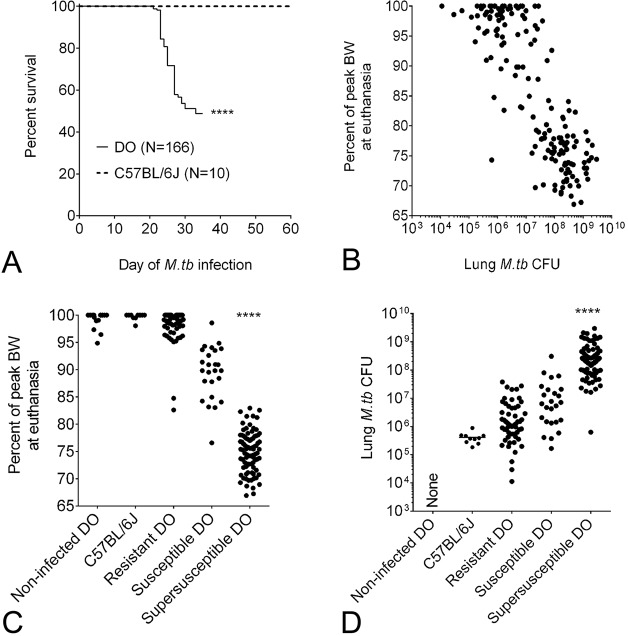
Fig. 1.
M. tuberculosis infection and TB disease indicators in mice. Female 8-week-old non-sibling DO mice (N=166) and C57BL/6J mice (N=10) were infected with ∼100 M. tuberculosis (M.tb) bacilli by aerosol. Survival was assessed by euthanasia owing to morbidity or by euthanasia at day 35 of infection, whichever came first. Survival of DO mice compared with that of the parental C57BL/6J strain was analyzed by using a Log-rank test, ****P<0.001 (A). The percentage of peak body weight (BW) and lung M. tuberculosis CFU were strong, significant negative correlations in DO mice (Spearman r −0.79, P<0.001, 95% CI −0.84 to −0.72) (B). The percentage of peak BW (C) and lung M. tuberculosis burden (D) from non-infected, resistant, susceptible and supersusceptible (described in the Materials and Methods) DO mice, and C57BL/6J mice were analyzed by using ANOVA with Tukey's post-test, ****P<0.0001. Data are combined from two independent experimental infections: N=97 DO mice in the first experiment, N=69 DO mice and N=10 C57BL/6J mice in the second experiment.

