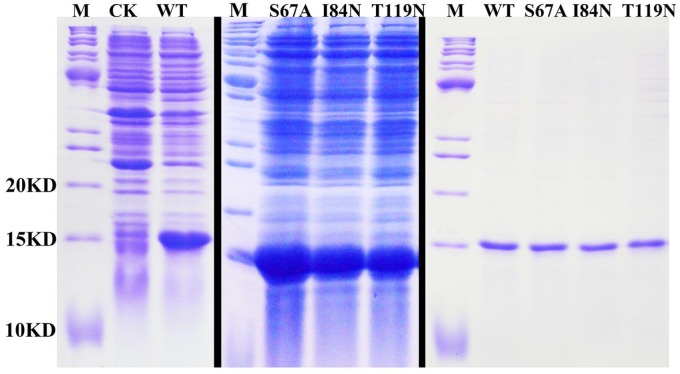
Figure 3.
SDS-PAGE analyses showing the expression and purification of the recombinant OBPs. M, molecular marker; CK, bacterial cells before induction by IPTG. The first two pictures show the bacterial cells after induction by IPTG. The last picture shows the purified protein of DhelOBP21-WT, S67A, I84N, T119N.

