Fig. 1.
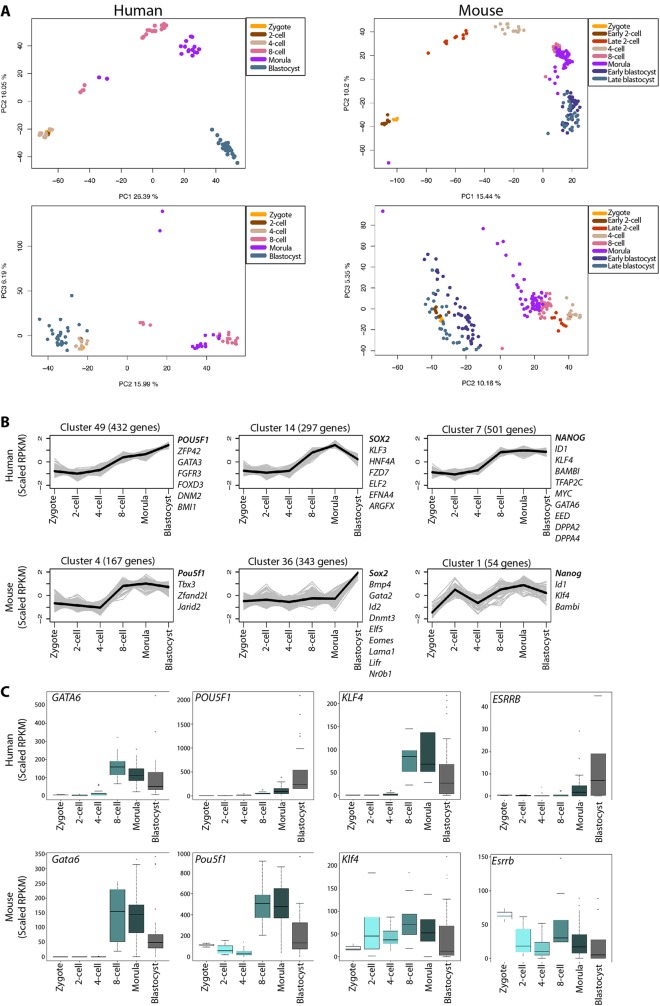
Global gene expression dynamics in human and mouse preimplantation development. (A) Principal component analysis of human (Yan et al., 2013) or mouse (Deng et al., 2014) single-cell RNA-seq transcriptomes. Each point represents a single cell and labelled according to developmental stage. Data were plotted along the first and second principal components and the second and third principal components. (B) K-means clusters showing selected genes co-expressed with Pou5f1/POU5F1, Sox2/SOX2 or Nanog/NANOG in mouse or human pre-implantation embryos. Grey line corresponds to scaled RPKM values for genes and black line corresponds to median expression within the cluster. (C) Boxplots of RPKM values for selected genes showing the range of single-cell gene expression at each of the selected development stages. Boxes correspond to the first and third quartiles, horizontal line to the median, whiskers extend to 1.5 times the interquartile range and dots denote outliers.

