Fig. 5.
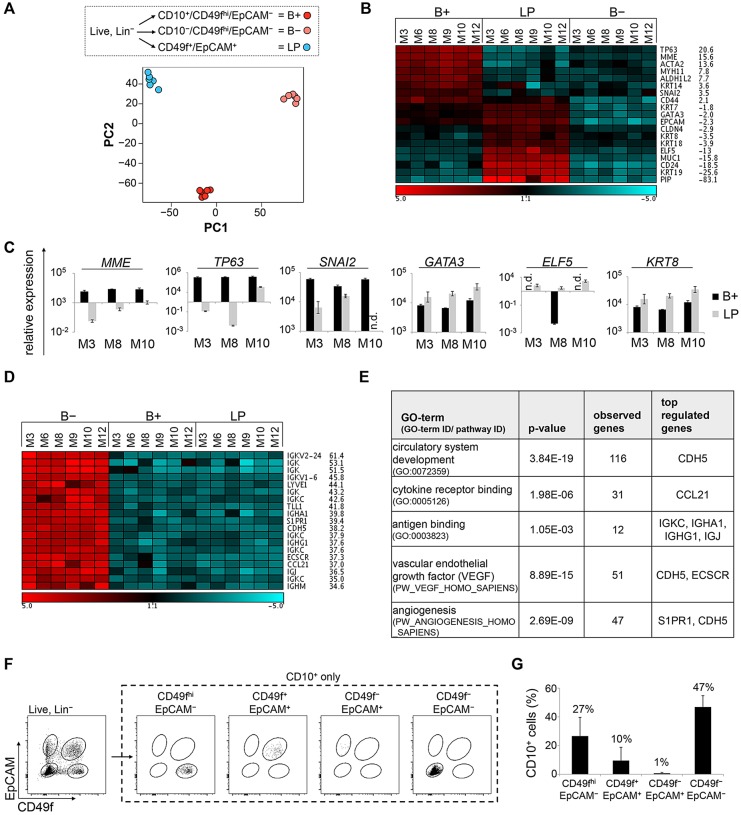
CD10 staining reveals a stromal component within the CD49fhi/EpCAM− population. (A) Gene expression profiling: RNA for microarray analysis derived from three subpopulations (B+, B− and LP, as indicated) using freshly isolated HMECs from six donors (M3, M6, M8, M9, M10, M12). Unsupervised clustering of all samples was followed by principal component analysis (PCA). (B) Heatmap: expression values of up- and downregulated luminal and basal genes in all samples. Fold-change of B+ versus LP expression levels. Red (high) and blue (low) indicates log2 expression values. Scale bar is in log2. (C) RT-PCR: MME/CD10, TP63, SNAI2, GATA3, ELF5 and KRT8 mRNA expression in B+ and LP cells. n=3. (D) Heatmap: expression values of the top 20 significantly (FDR<10%) upregulated genes in B− samples versus B+ samples with corresponding fold-changes. Red (high) and blue (low) indicates log2 expression values. Scale bar is in log2. (E) GO term analyses: selected significantly enriched terms (P<0.01) associated with genes differentially regulated between B− and B+ populations (FDR<10%, FC>3×). (F) Representative flow cytometry analysis showing CD10+ fraction within the four populations defined by CD49f/EpCAM. (G) Quantification of F. Average of 10 donors (M1-M10). n.d., not detectable. (C,G) Data are shown as mean±s.d.

