Fig. 5.
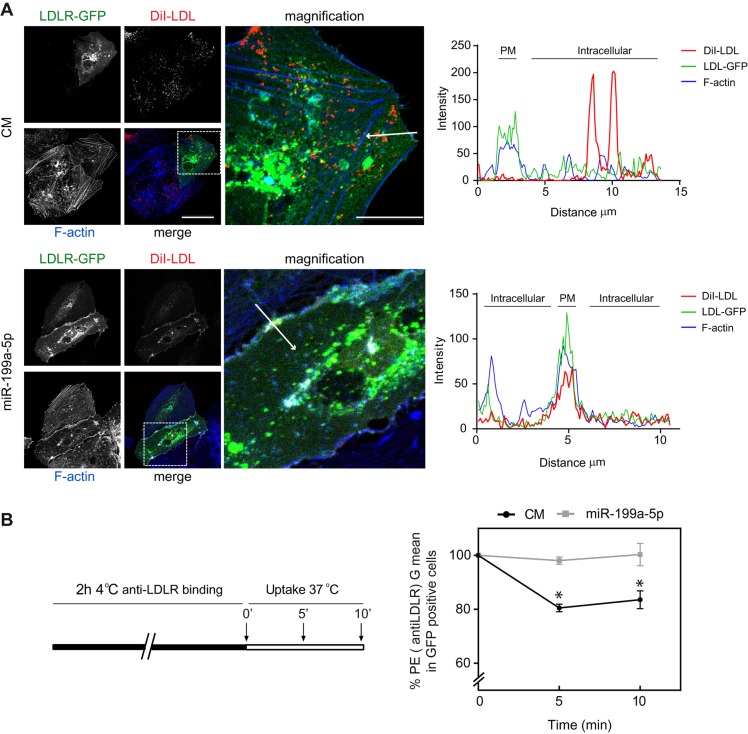
MiR-199a-5p regulates internalization of LDLR. (A) Representative confocal images of DiI–LDL, LDLR–GFP and F-actin expression in Huh7 cells co-transfected with LDLR–GFP and control mimic (CM) or miR-199a-5p mimic and incubated with 30 μg/ml DiI–LDL for 1 h at 37°C. Scale bars: 10 μm (main images); 2.5 µm (magnification images). Fluorescence intensity plots for LDLR–GFP (green), F-actin (blue) and DiI–LDL (red) signals along the arrow in the image are shown in the right panels. PM, plasma membrane. (B) Schematic representation showing the timecourse experiment followed in the right panel. Huh7 cells transfected with LDLR–GFP and control mimic or miR-199a-5p was incubated with anti-LDLR antibodies at 4°C for 2 h, washed and then switched to 37°C to allow internalization for 5 and 10 min. Cells were then stained with anti-phycoerythrin secondary antibodies, washed, fixed with PFA and analyzed by FACS. The graph shows the level of LDLR internalization in gated LDLR–GFP-positive cells as the percentage of phycoerythrin fluorescence. Data are expressed as the geometrical mean (G mean) percentage compared with that for the control mimic at time 0 min (±s.e.m.) and are representative of ≥3 experiments in triplicate. *P≤0.05.

