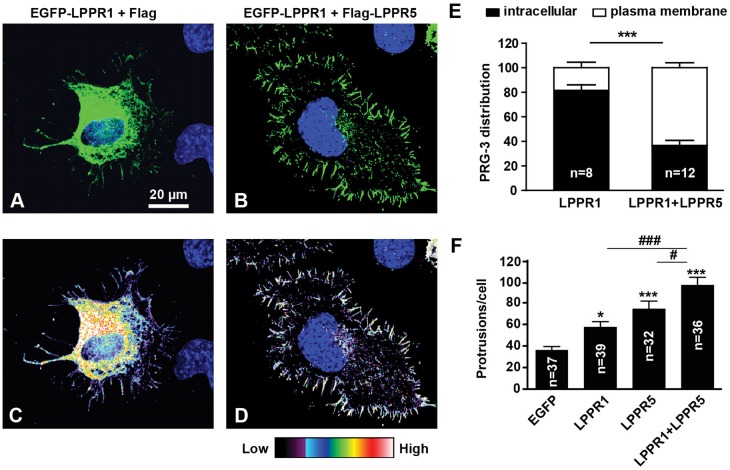
Fig. 7.
LPPR5 facilitates the localization of LPPR1 to the plasma membrane, which further increases the number of plasma membrane protrusions. (A–E) Representative images and quantification of the distribution shift of LPPR1 by LPPR5. Neuro2A cells plated on laminin were transfected with EGFP–LPPR1 and Flag (A,C), or EGFP–LPPR1 and Flag–LPPR5 (B,D). C and D show the fluorescence intensity of EGFP–LPPR1 in a heat-map format. The percentages of intracellular LPPR1 and cell surface LPPR1 were measured and the quantification (mean±s.e.m.) is shown in E. More EGFP–LPPR1 was localized to plasma membrane when co-expressed with LPPR5. ***P<0.001 (two-way ANOVA and Bonferroni post test). (F) Coexpression of LPPR1 with LPPR5 produced an enhanced induction of plasma membrane protrusions. Results are mean±s.e.m. *P<0.05; ***P<0.001 compared to EGFP control group; #P<0.05 compared to LPPR5 group; ###P<0.001 compared to LPPR1 group (one-way ANOVA and Tukey's multiple comparison test).

