
Fig. 1.
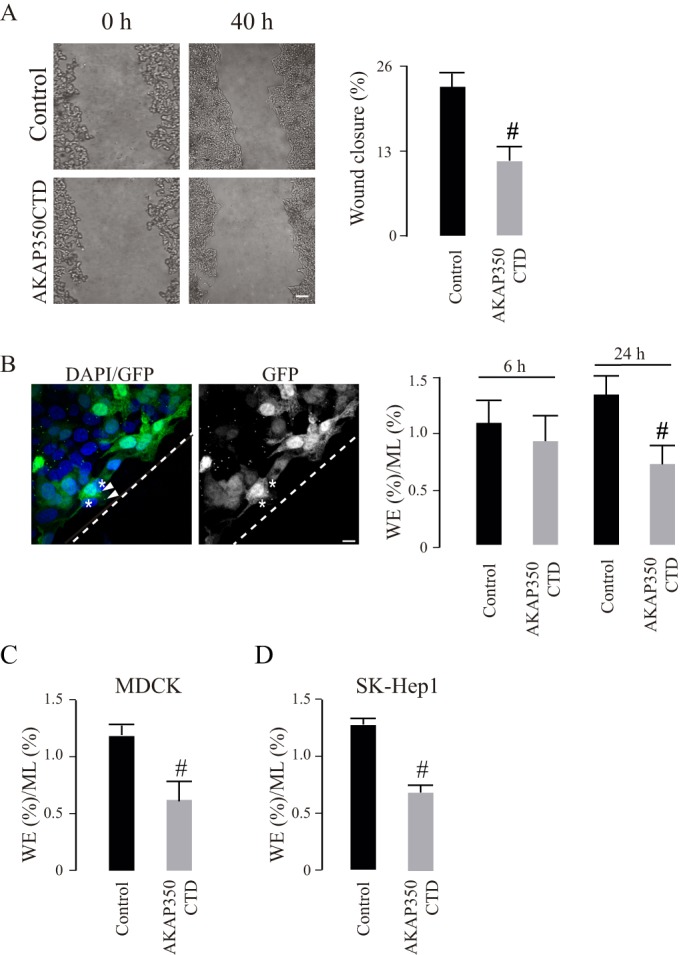
Participation of centrosomal AKAP350 in cell migration. (A) HepG2 cells stably expressing EGFP (control) or EGFP–AKAP350CTD (AKAP350CTD) were grown to confluence and subjected to scratch wounding (t0). Phase contrast images illustrate wound gaps at 0 h and 40 h. The bar graph represents the average difference between gap areas from the same field at 0 h and 40 h, expressed as a percentage of the initial gap area. (B–D) Equal amounts of HepG2, MDCK or SK-Hep1 control and AKAP350CTD cells were mixed, and wound healing assays were performed. Cells were fixed at 6 h and 24 h (HepG2), at 5 h (MDCK) or at 3 h (SK-Hep1) and stained with DAPI; images were then analyzed by using confocal microscopy. The quantity of control and AKAP350CTD cells at the wound edge (WE) and in the unperturbed confluent monolayer (ML) were determined. The image shows HepG2 cell distribution at the wound edge at 24 h (B). The bar graph represents the average ratio between the percentages of cells in both locations for HepG2 (B), MDCK (C) and SK-Hep1 (D) cells. Data are expressed as means±s.e.m. of at least eight fields (A) or 150 cells distributed in six separate fields corresponding either to the WE or the ML (B–D), representative of four (A), five (B) or three (C,D) independent experiments Dashed lines indicate the wound direction. Asterisks indicate AKAP350CTD cells at the wound edge, whereas arrowheads specify AKAP350CTD expression at the centrosomes in these cells. #P<0.05. Scale bars: 200 µm (A); 10 µm (B).