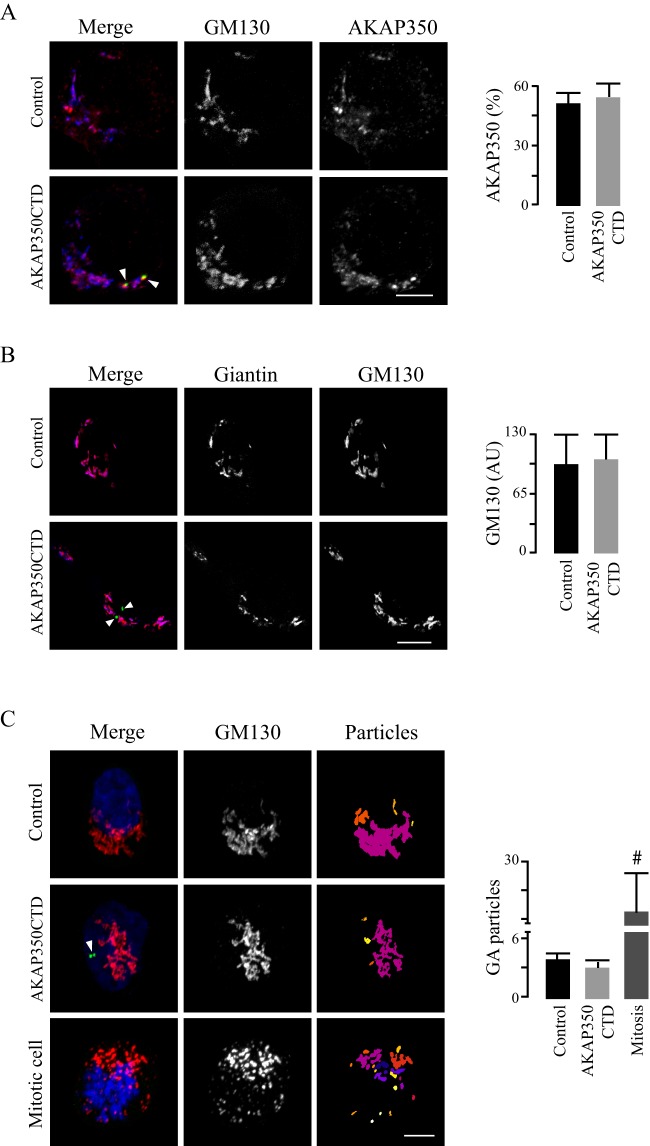
Fig. 3.
The Golgi complex in AKAP350CTD cells. Control and AKAP350CTD cells were mixed, grown to confluence, fixed and stained with DAPI, anti-GM130 and anti-AKAP350 or anti-giantin antibodies. Images were obtained by using confocal microscopy and analyzed using ImageJ tools. Comparisons were performed by pairing cells within the same field. (A) Merged images show AKAP350CTD expression (green), and staining of AKAP350 (red) and GM130 (blue). AKAP350 fluorescence corresponding to the Golgi was established by delimiting its volume with a GM130 mask. Bar graphs show the density of AKAP350 fluorescence corresponding to the Golgi complex expressed as percentage of the total cell fluorescence. (B) Merged images show AKAP350CTD expression (green), and staining of GM130 (red) and giantin (blue). Bar graphs show the density of GM130 fluorescence corresponding to the Golgi, the volume of which was delimited using a giantin mask. (C) Merged images show AKAP350CTD expression (green), and staining of GM130 (red) and DNA (DAPI, blue). Golgi architecture was analyzed by using the ImageJ 3D object counter plugin. The third column shows the z-projection of the differentially colored Golgi-complex (GA) particles. Bar graphs shown the number of Golgi particles per cell for each group of cells. Mitotic cells, identified by using their chromosomal morphology, were used as a methodological control. Arrowheads indicate centrosomal AKAP350CTD expression. Data are expressed as means±s.e.m. of at least 40 cells, representative of three independent experiments. #P<0.01. AU, arbitrary units. Scale bars: 5 µm.

