. 2015 Aug 25;4:e08193. doi: 10.7554/eLife.08193

Figure 1. Unwrapping of ssDNA from Escherichia coli SSB under mechanical tension.

(A) Crystal structure (Protein Data Bank ID number 1EYG) and schematic representation of an E. coli SSB tetramer wrapped by 70 nt of ssDNA (blue) in the (SSB)65 mode. From 5′ to 3′, ssDNA interacts with the yellow, purple, green and red subunits. (B) Schematic of SSB unwrapping experiment. A DNA construct consisting of two long double-stranded DNA (dsDNA) handles and a short (dT)70 ssDNA site is tethered between two optically trapped beads in the absence of SSB (Position 1, panel C). When moved to the stream containing SSB (Position 2), a single SSB tetramer binds to the ssDNA site at low tension (∼0.5 pN). The tethered DNA is moved back to the blank stream (Position 1) and a ramping force is applied. Stretching the nucleoprotein complex to >20 pN causes the SSB to dissociate. (C) Experimental flow chamber. Two separate streams containing experimental buffer only (red, Position 1) and buffer plus 0.5 nM SSB (blue, Position 2) form a laminar interface with minimal mixing. (D) Representative force-extension curves (FECs). Relaxing curves (red) are obtained after SSB dissociation, and are well fit to a polymer model of bare DNA (black dotted line, ‘Materials and methods’). Stretching curves (purple) of the SSB-ssDNA complex deviate from a model assuming the protein adopts the (SSB)65 wrapping mode at all forces (black dashed line). Cartoon illustration of SSB unwrapping shows the SSB behavior at particular forces. (E) Change in extension upon SSB wrapping vs applied force. The change in extension is determined from the extension difference between stretching and relaxing curves in (D). Individual traces (gray) are binned and averaged to yield a mean change in extension (black opened circle; error bars are S.D.). The data deviates from the model (dashed line, determined from the difference between the dashed and dotted lines in (D)) at forces >1 pN. Representative traces (red, green, and blue) display the differences between the individual and averaged traces.

DOI: http://dx.doi.org/10.7554/eLife.08193.003

Figure 1.

Figure 1—figure supplement 1. Dissociation of SSB upon DNA stretching.

Figure 1—figure supplement 1.

Averaged stretching (blue) and relaxing (red) FEC from Figure 1D, and bare DNA FEC (green). Both the relaxing and bare DNA stretching curves are fitted to the polymer elasticity model with 3260 bp dsDNA handles and 70 nt ssDNA (black dashed line, ‘Materials and methods’). The model assumes zero extension at zero force and fits the data. The resulting fits are consistent with each other, indicating that SSB has dissociated during stretching. Error bars are S.D.

Figure 1—figure supplement 2. Single-stranded DNA polymer modeling.

Figure 1—figure supplement 2.

Representative FEC of stretching and relaxing a DNA construct containing 3260 bp dsDNA handles and 70 nt (green) or 140 nt (orange) ssDNA. The total extension of the tether is modeled by the sum of dsDNA and ssDNA extensions. The dsDNA segment is modeled using the extensible worm-liked chain (XWLC), while the ssDNA segment is fitted to the snake-like chain (SLC; ‘Materials and methods’). Black dashed and dotted lines are fits to the 70 nt and 140 nt ssDNA constructs, respectively. The extension difference (inset, blue) between 70 nt and 140 nt ssDNA constructs illustrates the validity of the ssDNA elasticity model over short lengths (70 nt).

Figure 1—figure supplement 3. Dissociation force of SSB-ssDNA.

Figure 1—figure supplement 3.

Cartoon schematic and representative traces showing combined fluorescence and DNA extension measurements. A DNA construct bound by fluorescently labeled SSB, SSBf, is stretched (blue) and relaxed (red) under mechanical force. Upon reaching a force ∼10 pN, SSBf dissociates from the DNA as indicated by the decrease in fluorescence. The relaxing curves from the corresponding FECs match the polymer elasticity model of bare DNA (black dotted line, ‘Materials and methods’) indicating that the SSB has dissociated during stretching. The dissociation force from the FECs is consistent with the fluorescence data.

Figure 1—figure supplement 4. Sample chamber.

Figure 1—figure supplement 4.

Image and schematic of a laminar flow chamber. Two glass coverslips are used to sandwich patterned parafilm (Nescofilm). For illustration purposes, food dye of different colors is flowed into the chamber via inlet tubing at a rate of 100 µl/hr. Two streams, one containing experimental buffer only (red, 1), and the other containing buffer plus SSB (blue, 2), merge into the central channel but do not mix appreciably due to the laminar flow. The chamber design allows rapid exchange of buffer conditions by moving the optical traps across the stream interface. The top channel (yellow) is loaded with anti-digoxigenin beads, while the bottom channel (green) is loaded with DNA-bound streptavidin beads. Both beads diffuse through glass capillaries into the middle channel where the optical trapping experiment is performed.

Figure 1—figure supplement 5. DNA construct.

Figure 1—figure supplement 5.

Schematic of single-stranded DNA construct. The DNA construct consists of three separate fragments ligated together (‘Materials and methods’): ‘Right Handle’ (RH), ‘Left Handle’ (LH), and ‘Binding Site’ (BS). The handles served as functionalized linkers that connect to trapped beads through biotin-streptavidin and digoxigenin-anti-digoxigenin linkages and spatially separate the beads from the protein binding site.

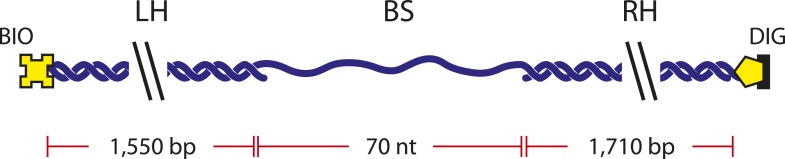
Figure 1—figure supplement 6. SSB binds to dT70 in the fully wrapped (SSB)65 mode at a 1:1 molar ratio in 100 mM Tris buffer.

Figure 1—figure supplement 6.

Results of an equilibrium titration of Cy5-(dT)70-Cy3-dT-3′ (0.1 μM) with SSB (left panel; 100 mM Tris-HCl, 20 mM NaCl, 0.1 mM EDTA, 25°C) plotted as normalized Cy5 fluorescence (Fn = (FF0)/F0) vs molar ratio of total SSB protein (tetramer) to total DNA concentrations (where F0 is the fluorescence intensity of DNA alone and F is the fluorescence measured at each point in the titration). The biphasic character of the binding isotherm indicates that two types of complexes can form, the first having one and the second having two tetramers bound and characterized by high and intermediate FRET values ((SSB)65 and (SSB)35 modes, respectively). The continuous line represents the best fit to the data based on a two-site model (Roy et al., 2009) with equilibrium binding constants, k1 = 1 × 10¹⁰ M−1 (minimum estimate) and k2 = (1.21 ± 0.04) × 108 M−1 and two additional parameters F1 = 10.1 ± 0.1 and F2 = 4.8 ± 0.1, reflecting the maximum Cy5 fluorescence observed for one and two tetramers bound, respectively. Species distribution predicted from the best fit parameters listed above (right panel). At low concentration of SSB tetramers the protein binds to dT70 exclusively in the fully wrapped (SSB)65 binding mode, although as the SSB concentration increases ([SSB]tot/[dT70]tot > 1) the (SSB)35 binding mode starts to form in which two SSB tetramers are bound to one molecule of dT70.