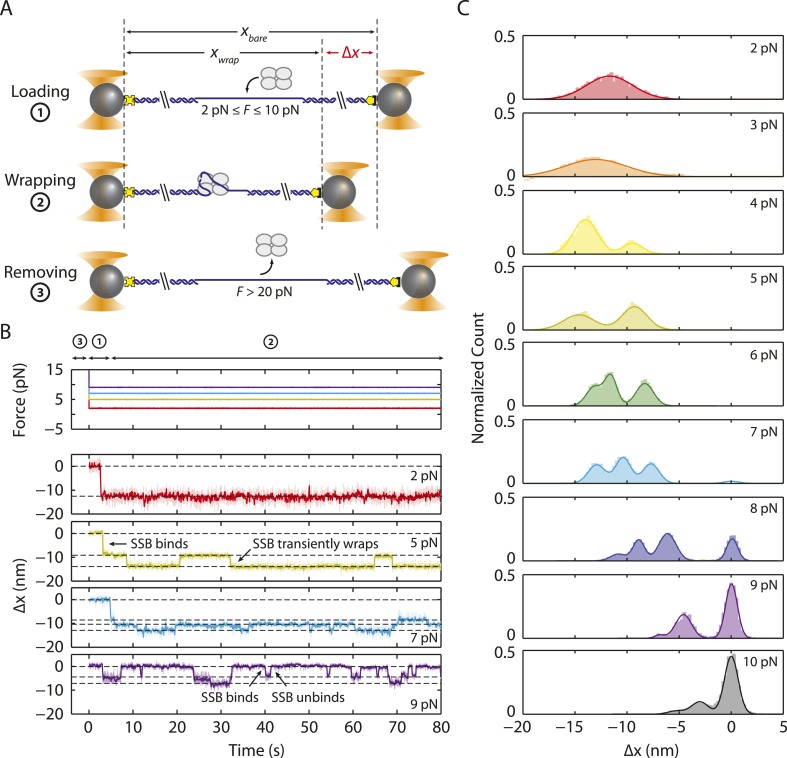
Figure 2. Intermediate ssDNA wrapping states of SSB under tension.
(A) Schematic of SSB constant force wrapping experiment. A DNA construct is held between two optical traps under a constant tension between 2–10 pN in the presence of protein. An extension change, Δx, is measured upon SSB binding, wrapping or unwrapping ssDNA. At the end of each observation, SSB is removed by stretching the DNA construct to high force (>20 pN). (B) Representative time traces of SSB-ssDNA wrapping at 2, 5, 7, and 9 pN (red, green, blue, and purple respectively). Extension change data were acquired at 66 kHz and boxcar averaged to 10 Hz (dark color). In all traces, SSB first binds and compacts ssDNA as indicated by an extension decrease. Depending on tension, SSB displays several intermediate wrapping states. Black dashed lines represent the mean extension change of each particular wrapping state. (C) Extension change distribution from many SSB wrapping traces at constant tensions between 2–10 pN. The color map matches that in (B). Solid lines are multi-Gaussian fits to the distributions.


