. 2015 Aug 25;4:e08193. doi: 10.7554/eLife.08193

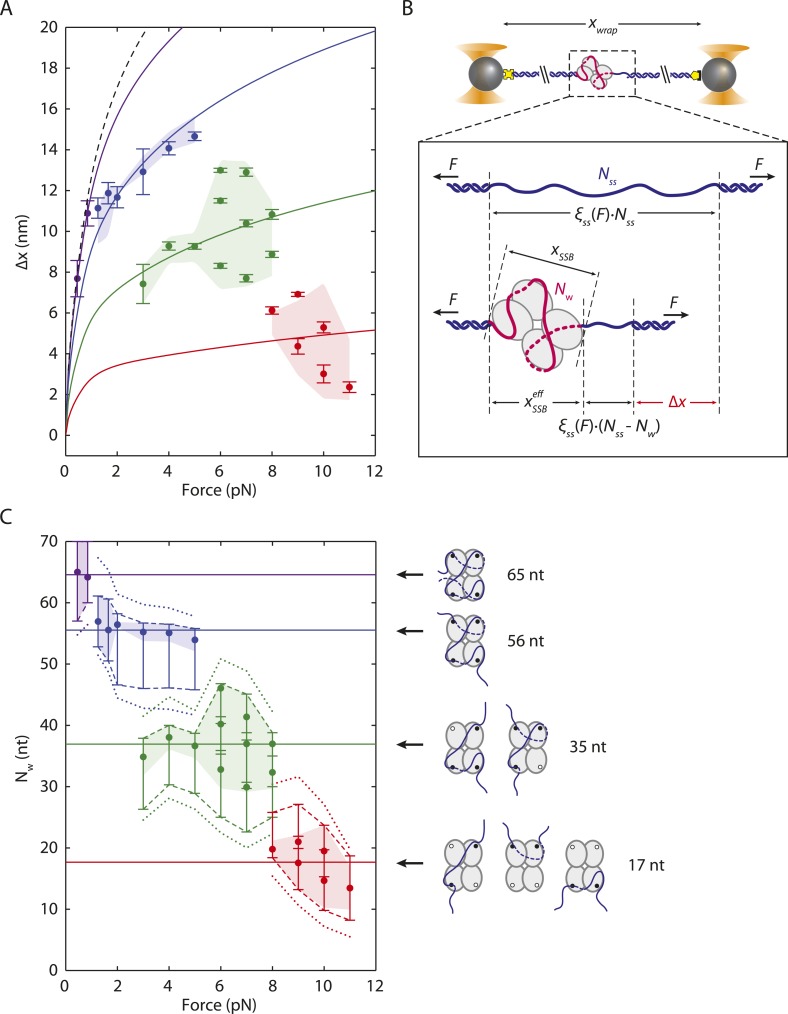
Figure 3. SSB wrapping modes.

(A) Mean change in extension Δx vs tension for each wrapping state, derived from the peaks of the distributions in Figure 2C. Error bars represent S.E.M. and were determined by bootstrapping. The dashed line is the model in Figure 1D. Solid lines represent models of Δx based on Equation 3 for SSB wrapping Nw = 65, 56, 35, and ∼17 nt (purple, blue, green, and red, respectively; ‘Materials and methods’). Data points are clustered into 4 groups corresponding to those states (purple, blue, green, and red circles). (B) Schematic representation of Δx. Top: Bare ssDNA (with Nss = 70 nt) and its extension, xbare, based on a polymer elasticity model Equation 1 (‘Materials and methods’). Bottom: SSB-wrapped ssDNA showing the number of wrapped nucleotides, Nw (<70, red) and the remaining unwrapped nucleotides (NssNw, blue). The extension of wrapped DNA, xwrap is calculated from an elasticity model and the effective physical size of the SSB-ssDNA complex, xSSBeff, Equation 2 (‘Materials and methods’). Δx is the difference between xwrap and xbare, Equation 3. (C) Number of wrapped nucleotides Nw vs tension F. Each data point in (A) is mapped to Nw using the model described in the text (‘Materials and methods’; Figure 3—figure supplement 1). Dotted lines represent the maximum possible range of Nw for each colored group of points based on xSSBeff being <6.5 nm (Figure 3—figure supplement 1, left panel). Dashed lines represent a tighter range of possible Nw for each group of points derived from the SSB-ssDNA structure (Figure 3—figure supplement 1, middle panel). Error bars represent this range for each individual data point. The shaded areas represent the tightest range of possible Nw for each group based on the ‘hotspot’ analysis described in the text (Figure 3—figure supplement 1, right panel). The points are the best estimates of Nw from the model. The shaded areas and solid lines in (C) map directly to those in (A). Cartoon schematics depict possible wrapping modes corresponding to the 4 groups.

DOI: http://dx.doi.org/10.7554/eLife.08193.012

Figure 3.

Figure 3—figure supplement 1. SSB wrapping models.

Figure 3—figure supplement 1.

Three-level modeling of SSB wrapping configurations. Schematics of SSB, wrapped ssDNA (blue), and the distance between wrapped ends, xSSB (black arrow; top panels). Each extension change data point Δx(F) in Figure 3A corresponds to a curve in the space of possible Nw and xSSB, according to Equation 5 (colored curves, bottom panels). The widths of the curves correspond to the error bars in Figure 3A. Selected data points from Figure 3A are displayed (purple: F = 0.8 pN, Δx = 11 nm, blue: 4 pN, 14 nm, green: 7 pN, 10 nm, and red: 9 pN, 7 nm). At the first level of modeling (left panels), xSSB is assumed to be limited only by the size of the protein (i.e., xSSB < 6.5 nm; dark gray shaded area). The range of possible Nw corresponding to each selected data point is shown by the colored dotted lines. At the second level (middle), the range of possible xSSB is refined by utilizing the (SSB)65 crystal structure. The end-to-end distance between every pair of nucleotides ni and nj along the ssDNA in the structural model defines a lower and upper bound of xSSB for each Nw (gray shaded area). This, in turn, narrows down the range of possible Nw for each data point (colored dashed lines). At the third level (right), four ‘hotspots’, residues on each SSB monomer with which nucleotides interact most strongly (green molecular surfaces in the schematic and green nucleotides), are used to refine the estimates for xSSB further. Three regions near the hotspots (black contours) are identified and used to calculate xSSB. The numbering (1, 2, and 3) corresponds to the configurations shown in Figure 3—figure supplement 2. This analysis provides the narrowest estimate for the range of Nw for each data point Δx (colored bands). The best estimates for Nw are obtained from the center of this range (black dots); these are plotted in Figure 3C vs force.
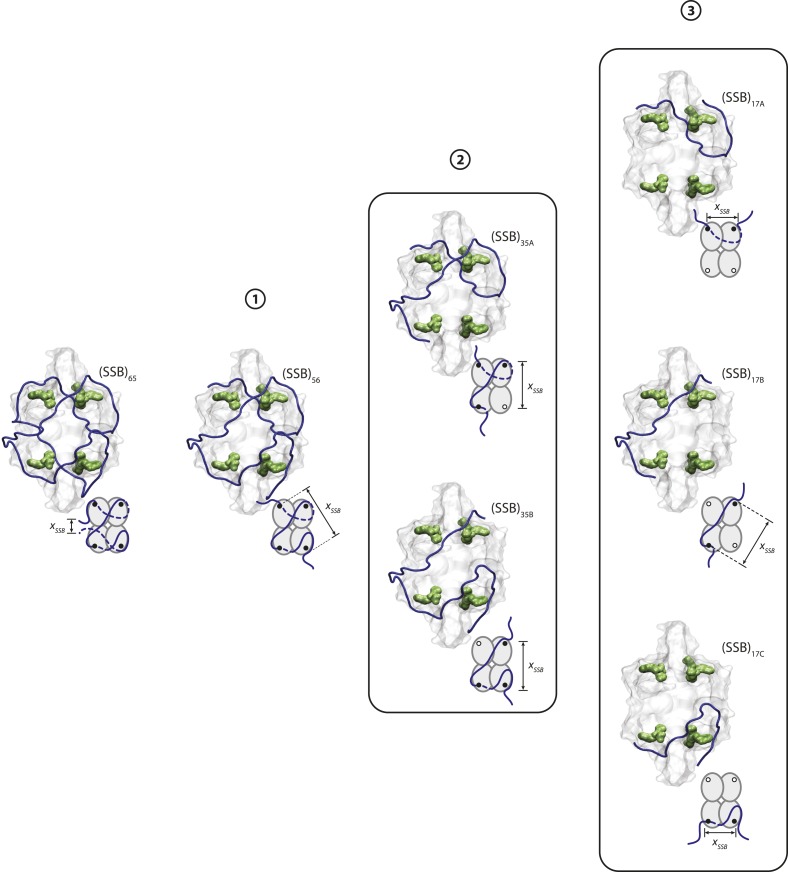
Figure 3—figure supplement 2. SSB wrapping pathway.

Figure 3—figure supplement 2.

Crystal structures and schematics of SSB wrapping ssDNA (blue) in different wrapping modes. Each mode illustrates possible wrapping configurations that correspond to the regions, numbered 1, 2, and 3 in Figure 3—figure supplement 1. As tension increases (from left to right), SSB wraps less ssDNA, and the number of hotspots interacting with ssDNA (green molecular surfaces in structures, black dots in schematics) decreases.
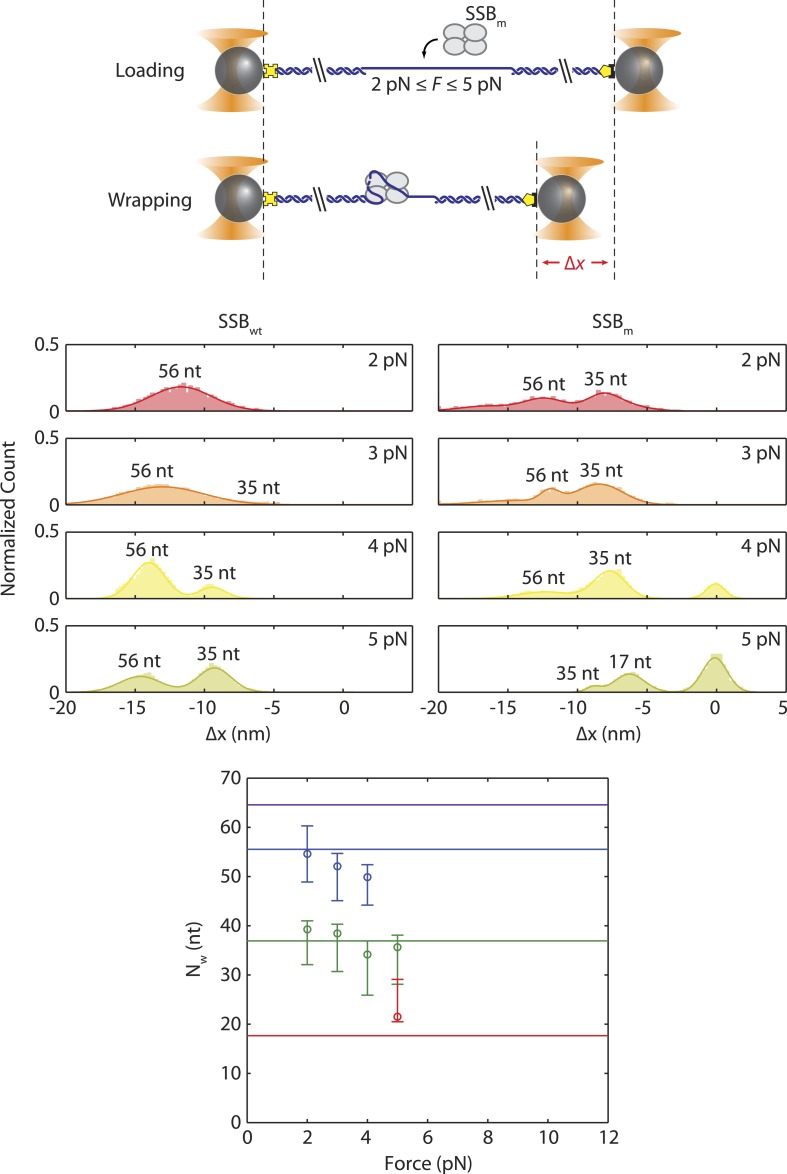
Figure 3—figure supplement 3. Wrapping modes of SSB mutant.

Figure 3—figure supplement 3.

Schematic of wrapping experiment using SSBm, a SSB mutant in which Trp-54 is replaced by Ser-54. Comparison of extension change distributions between wild-type SSB (left panels) and SSBm (right). At the same tensions (3–5 pN), SSBm wraps less ssDNA than wild-type SSB, and is more likely to wrap 35 nt. The mean number of wrapped nucleotides vs tension was estimated in the same way as for wt SSB (Figure 3C).