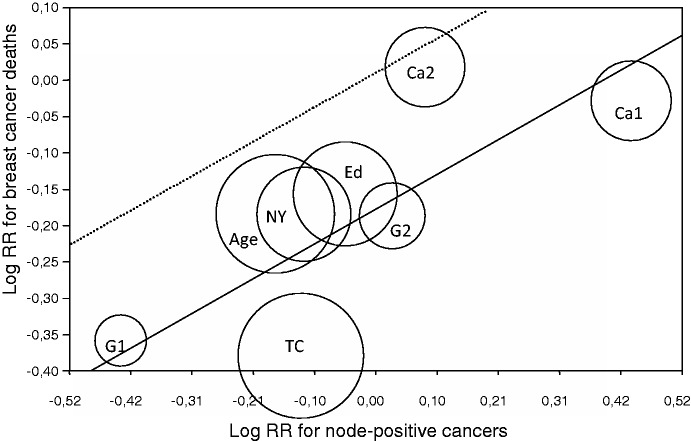
Figure 1.
Meta-regression of the risk ratio for dying from breast cancer after 13 years in relation to the risk ratio for detecting node-positive breast cancer. The circled areas are proportional in size to the weights. The hatched line represents an unbiased regression line that crosses (0.0) and has the same slope as the calculated regression line. RR: risk ratio; Age: UK Age Trial, 39–41 years; Ca1: Canada, 40–49 years; Ca2: Canada, 50–59 years; Ed: Edinburgh, 45–64 years; G1: Göteborg, 40–49 years; G2: Göteborg, 50–59 years; Ma: Malmö, 45–70 years; NY: New York, 40–64 years; TC: Two-County, 40–74 years.

