Fig. 4.
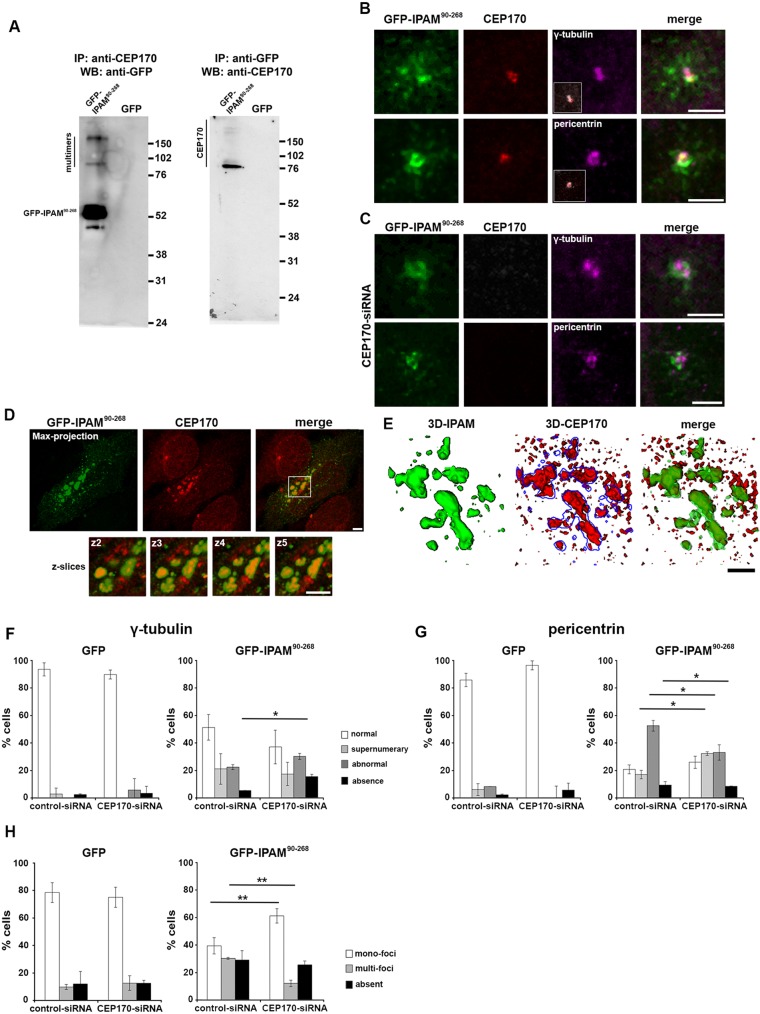
Functional interaction between GFP-IPAM90-268 and CEP170. (A) Western blots (WB) immunostained with anti-CEP170 or anti-GFP antibodies of SDS-PAGE-separated proteins immunoprecipitated (IP) with anti-CEP170 or anti-GFP antibodies. IPAM multimers are evident (see Fig. 3). Positions of molecular mass markers are indicated in kDa (right). (B) HeLa cells expressing low levels of GFP-IPAM90-268 (green) were fixed and co-stained for γ-tubulin or pericentrin (magenta) and CEP170 (red). Insets show CEP170 (red) and γ-tubulin or pericentrin (gray) labeling only. Scale bars: 2 µm. (C) HeLa cells treated with CEP170-siRNA and expressing GFP-IPAM90-268 (green) were fixed and co-stained for γ-tubulin or pericentrin (magenta) and CEP170 (red). Scale bars: 2 µm. (D) HeLa cells expressing high levels of GFP-IPAM90-268 (green) were fixed and stained for CEP170 (red). Panels show maximum projections of four confocal z-sections (left). Scale bar: 5 µm. Smaller panels below show indicated region at higher magnification (right) broken down into individual z-sections (2−5). Scale bar: 2 µm. (E) 3D reconstructions from structural illumination microscopy, demonstrating that GFP-IPAM90-268 colocalizes with CEP170. Scale bar: 2 µm. (F,G) γ-tubulin (F) or pericentrin (G) labeling was categorized (as described in supplementary material Fig. S2B) in HeLa cells treated with CEP170-siRNA or control-siRNA expressing GFP or GFP-IPAM90-268 as indicated. *P<0.05. (H) Quantification of the MT network (as described in supplementary material Fig. S2C) in HeLa cells treated with CEP170-siRNA or control-siRNA expressing GFP or GFP-IPAM90-268 as indicated. **P<0.01.

