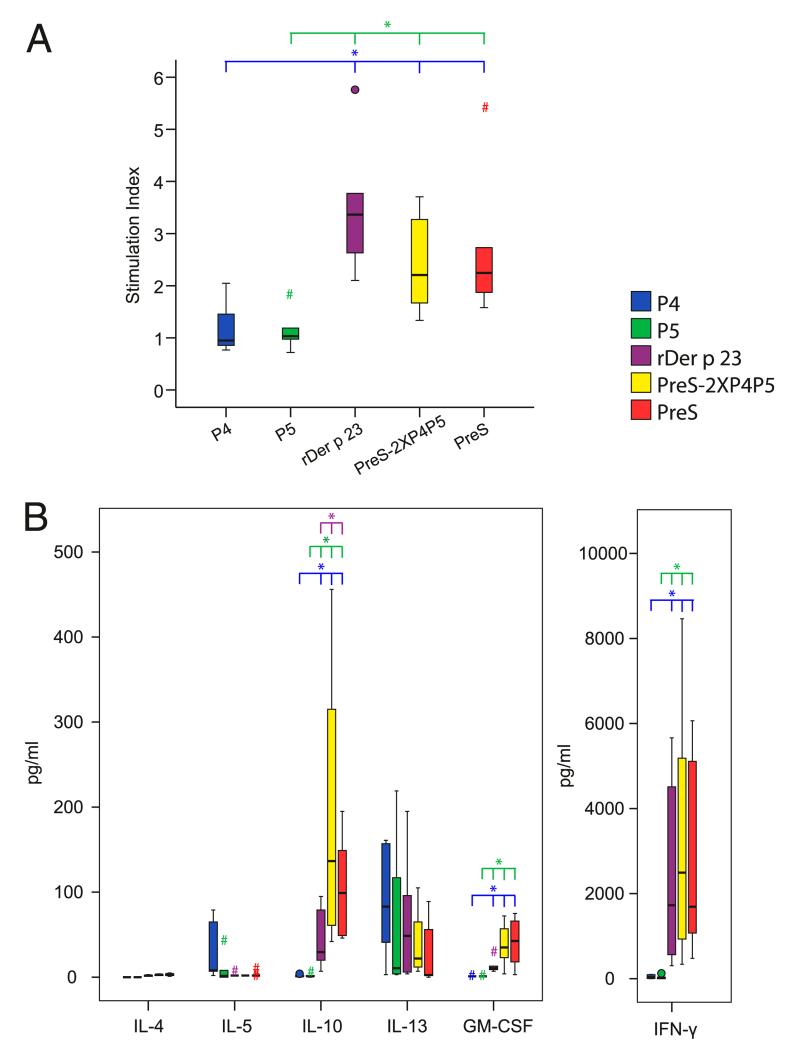
FIGURE 4.
Lymphoproliferative and cytokine responses to Der p 23, Der p 23 peptides, PreS, and PreS-fusion proteins. PBMCs from six patients with HDM allergy were stimulated with 1.25 μM of each Ag. Mean stimulation indexes (A) and cytokine responses (B) (y-axes) of triplicate cultures are shown in box and whiskers plots, where 50% of the values are within the boxes and nonoutliers between the bars. Extremes and outliers are indicated by hashtags and circles, respectively. Vertical lines at the top indicate the molecules that show statistically significant differences from the reference molecule of the same color as the bar. *p < 0.05, Mann–Whitney U test.

