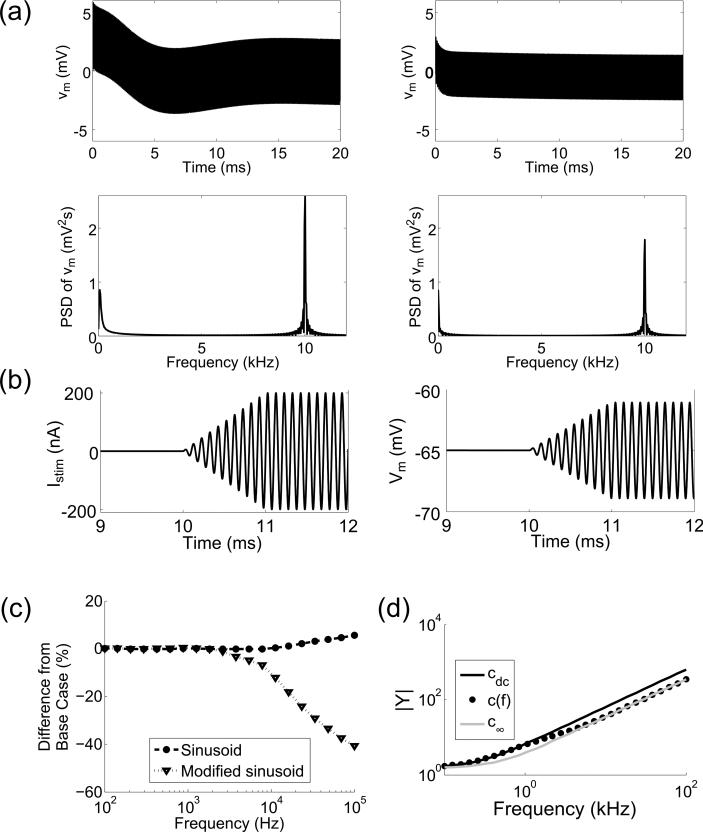
Figure 10.
The effect of the natural response on stimulation thresholds. (a) Reduced transmembrane voltage (vm = Vm – Vrest, top) and the PSD of vm (bottom) in the HH axon model (left) and the MRG axon model (right) in response to subthreshold stimulation with an intracellular 10 kHz sinusoidal current. (b) The transmembrane voltage (Vm, right) of the HH model axon in response to an intracellular sinusoidal current (left) with a peak-to-peak amplitude that increases linearly from 0 to its maximum value over 1 ms. (c) Differences in the stimulation thresholds between the cdc and c(f) cases for the HH axon model using a sinusoid and the ramped sinusoid described in (b). (d) Magnitude of the admittance, |Y|, of the equivalent circuit of the linearized HH cell with the small-signal approximation of (Sabah and Leibovic, 1969).

