Figure 8.
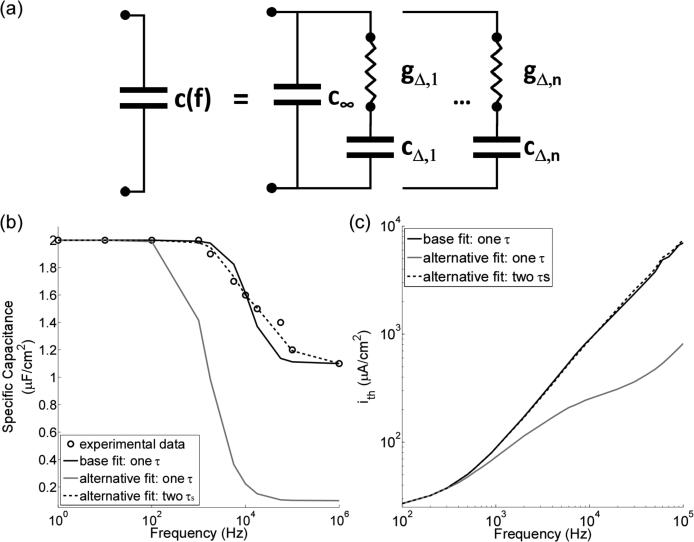
Sensitivity of the stimulation thresholds to changes in the representation of the frequency-dependent membrane capacitance, c(f). (a) Dielectric dispersion, or c(f), can be modeled with a single capacitance (c∞) in parallel with n different series combinations of a conductance and capacitance (see Equation 7). (b) Three curves of c(f) for the MRG SCM: the baseline fit (black line), where, n = 1, cdc = 2 μF/cm2, c∞ = 1.1 μF/cm2, and τ = (2π104)−1 s (see Section 2.2); an alternative fit similar to the baseline, except c∞ = 0.1 μF/cm2 (grey line); and a second alternative fit (dashed line), where n = 2, c∞ = 1.1 μF/cm2, cΔ,1 = 0.5 μF/cm2, cΔ,2 = 0.4 μF/cm2, τ1 = (2π4.9×10³)−1 s, and τ2 = (2π5.0×10⁴)−1 s. Experimental data from (Takashima and Schwan, 1974). (c) The stimulation thresholds of the MRG SCM for each of the three different representations of c(f) in part b. The stimulus was an intracellular sinusoidal current density (i).

