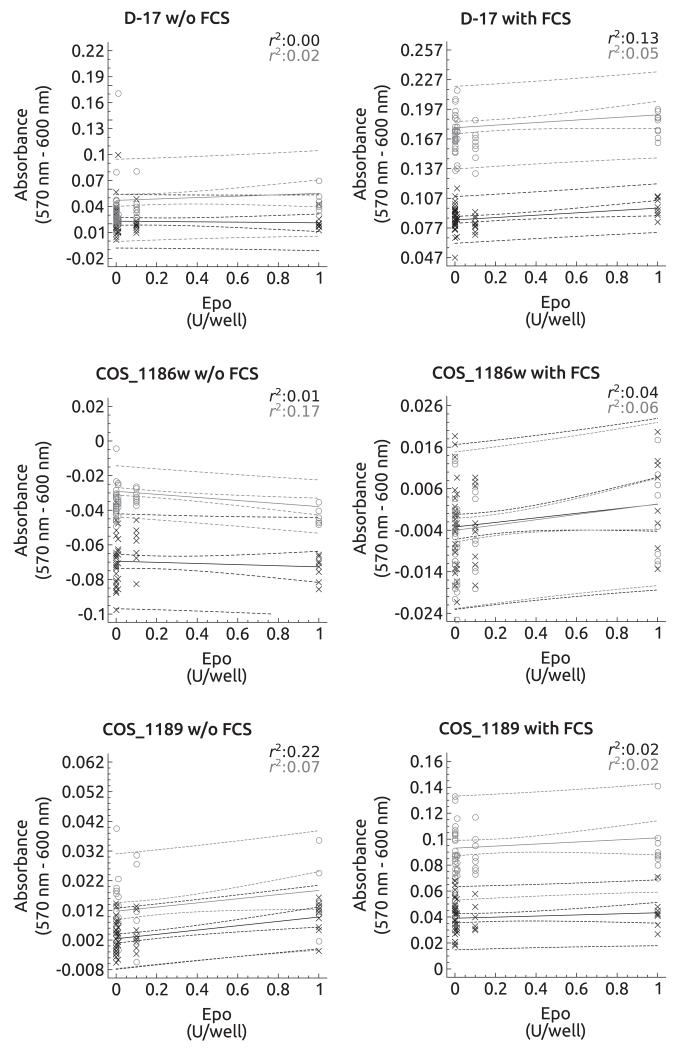
Fig. 3.
Regression plots of canine cultured cells in the presence of erythropoietin (EPO) (0, 0.1, 0.01, 0.001, 0.0001 and 1 U/well) with or without foetal calf serum (FCS). Regression plots for the 2 h interval are depicted in black and individual values are marked as x. The 4 h interval is depicted in grey showing the individual values as ○. D-17 and COS_1186w cells showed a marked decrease in absorbance in the absence of FCS, but an increase in absorbance after 4 h for D-17 and after 2 h and nearing significance after 4 h in COS_1186w cells when FCS was added. COS_1189 cells showed an increase in absorbance after 4 h (without FCS) and 2 h and 4 h in the presence of FCS.

