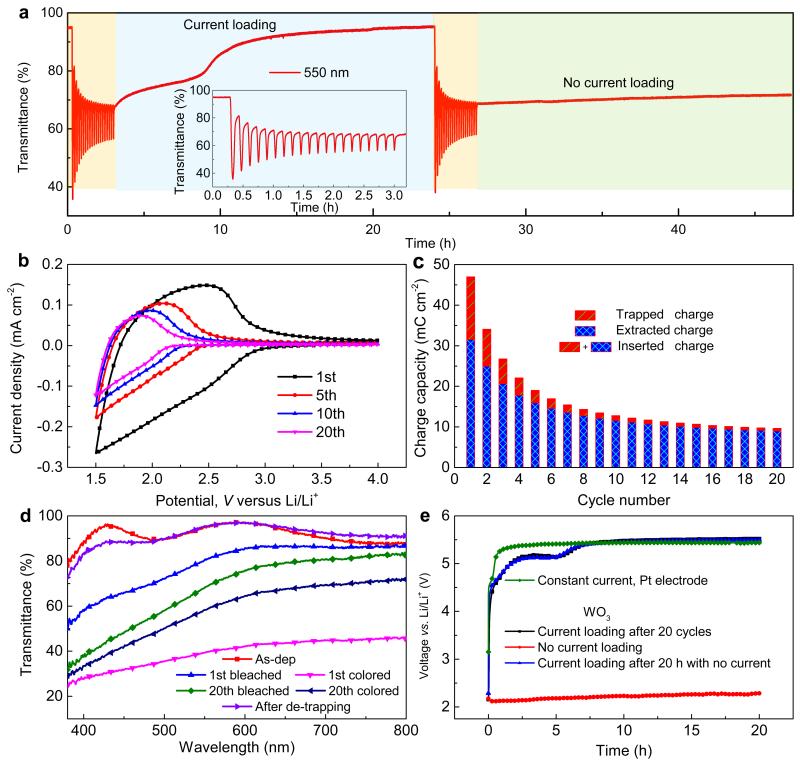
Figure 2. Electrochromic performance of WO3 films under varied operations.
(a) Comparison of optical response at 550 nm and for 1.5–4.0 V with and without constant loading current; inset shows a magnified view of the transmittance during 20 initial cycles at 10 mV s−1. (b) CV data for different cycle numbers at 10 mV s−1. (c) Trapped and extracted charge densities vs. cycle number derived from CV data. (d) Optical transmittance for the film in as-deposited state, after bleaching and coloring for the indicated number of cycles, and after galvanostatic ion extraction. (e) Voltage vs. time for WO3 films with and without constant current. The electrolyte response obtained with a Pt electrode is shown for comparison.

