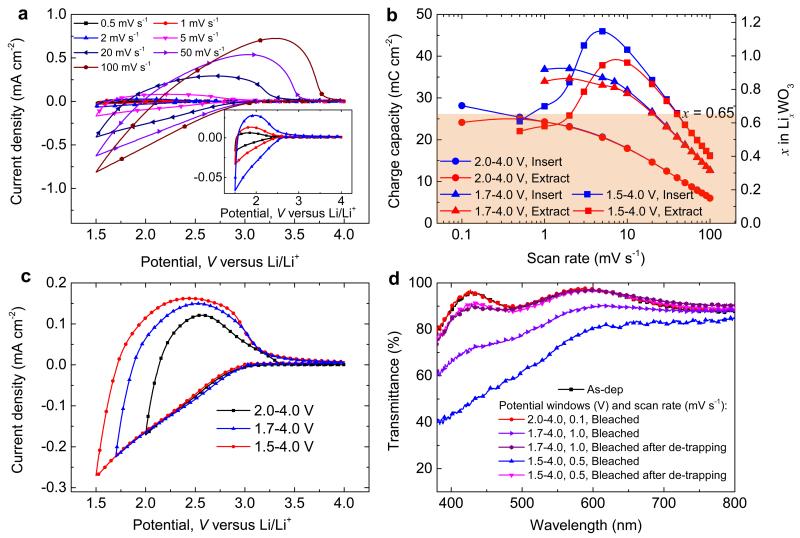
Figure 3. Dynamics of ion trapping and de-trapping in WO3 thin films.
(a) Cyclic voltammograms of films at various scan rates recorded for 1.5–4.0 V; inset shows vertically magnified data for the lowest scan rates. (b) Charge capacity vs. scan rate for films with charge extracted/inserted in the shown potential windows; right-hand axis indicates the amount of Li+-ions as x in LixWO3. (c) CV data for different potential windows recorded at 10 mV s−1. (d) Optical transmittance of films in as-deposited state and subjected to various procedures for ion-trapping (different potential windows, scan rates, and galvanostratic ion de-trapping). Spectral data for the as-deposited state and after bleaching at 2.0–4.0 V are overlapping, as are data for the bleached state of de-trapped films.

