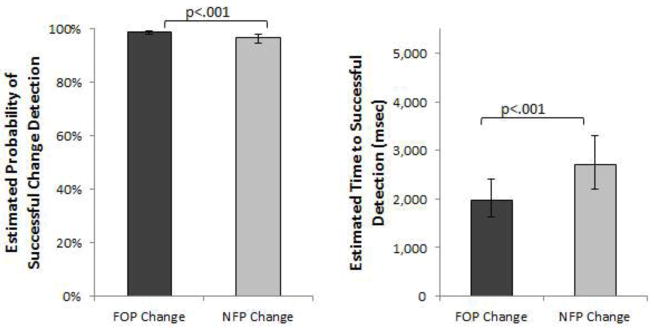
Figure 8.

Experiment 2- Estimated Probability of successful change detection during the allotted 10 second trial period as a function of whether the change occurred to the FOP or NFP (Panel A). Estimated time to detect the change for those trials in which the change was correctly identified as a function of whether the change occurred to the FOP or NFP (Panel B). Whiskers indicate the 95% confidence interval.
