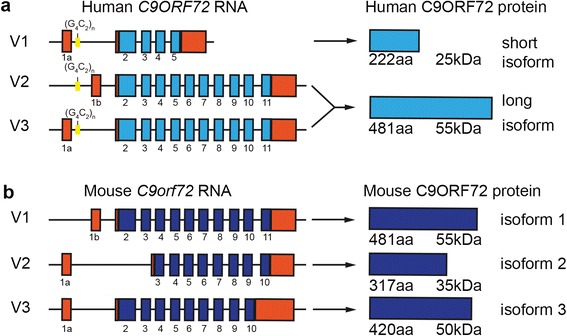
Fig. 1.

Schematic overview of human and mouse C9ORF72 transcripts and encoded proteins. Protein coding regions for transcript variants (V1 to 3) are indicated in light blue for human (a) and dark blue for mouse (b) as well as size of encoded proteins. Non-coding regions are indicated in red and location of the G4C2 repeat expansion in yellow.
