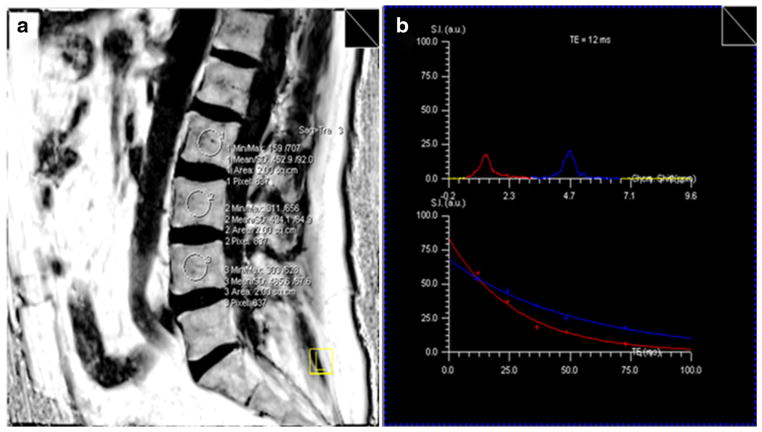
Fig. 1.
MRS assessment of bone marrow fat. a The circles within the lumbar spine body on MRI image are the regions of interest (10×10×10 mm3 voxels in the bone marrow region). Within each region, the T2-weighted proton spectra of TE=12, 24, 36, 48, and 72 ms and TR=4 s were acquired with STEAM techniques. b The signal intensity of water and fat peaks were quantified at each TE. The fat% was calculated from the T2-corrected water and fat signal intensities

