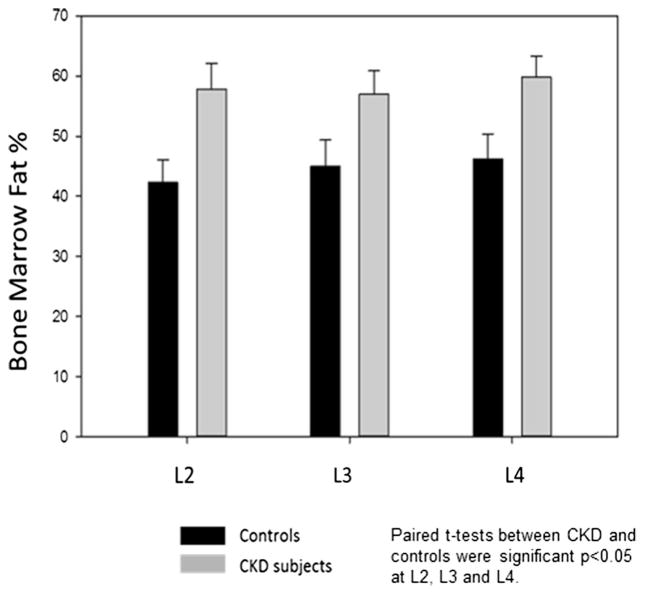
Fig. 2.
Percent bone marrow fat by MRS in CKD patients compared to controls. CKD subjects (black bars) were compared to age-, race-, and gender-matched controls (gray bars) for MRS at L2, L3, and L4 sites (eight matched pairs, total N=16). At each site, the percent bone marrow fat in patients with CKD was less than that in control subjects, p<0.05

