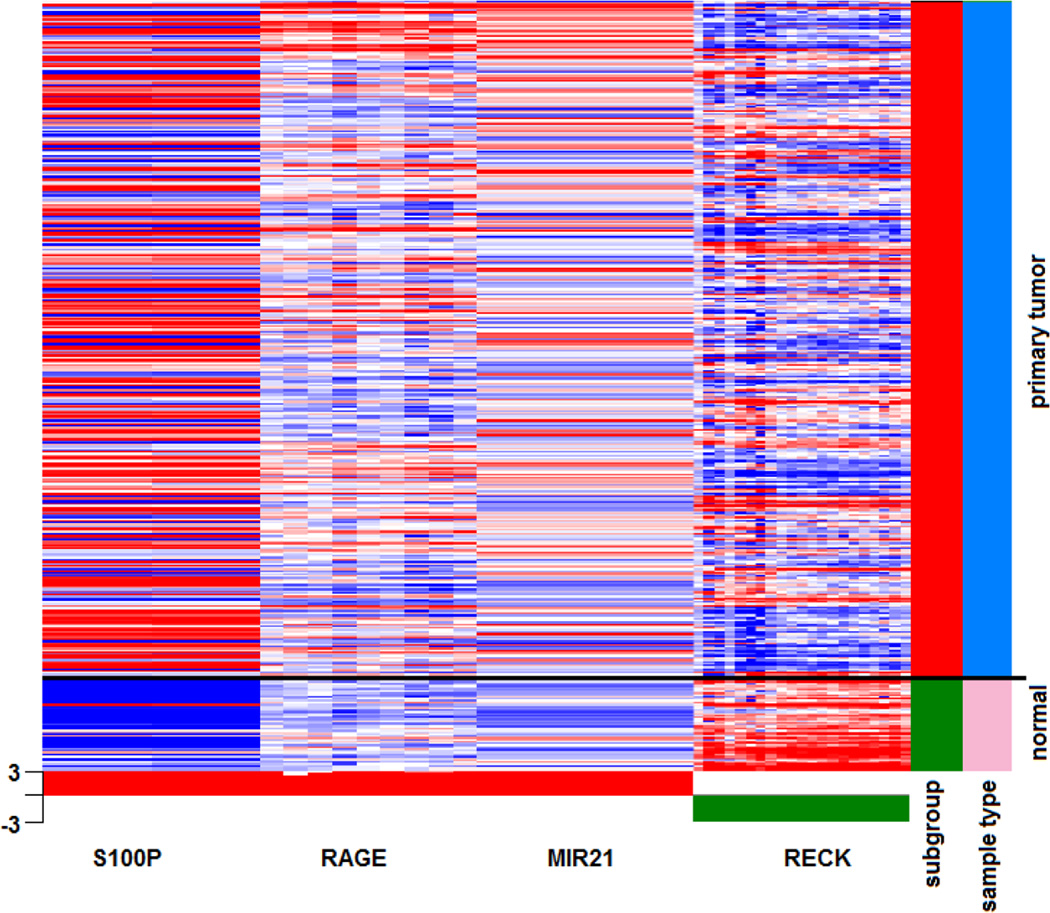
Figure 4. Expression analysis of S100P, RAGE, miR-21, and RECK in primary colorectal tumors using the TCGA database.
Exon expression analysis of S100P, RAGE, miR-21 and RECK in the TCGA dataset of colorectal adenocarcinoma (COADREAD) was performed by HiSeq Illumina sequencing of RNA samples obtained from fresh frozen tissues of primary colorectal tumors (in red, n=347) and normal solid tissues (in green, n=47). Red and blue in gene expression dataset represent over- and under-expression, respectively. The heatmap indicates increased expression of S100P, RAGE, and miR-21 and decreased expression of RECK in primary tumors compared to normal tissue. Statistical analysis was performed using Student’s t-test with Benjamini-Hochberg correction with p<0.05 considered as statistically significant.

