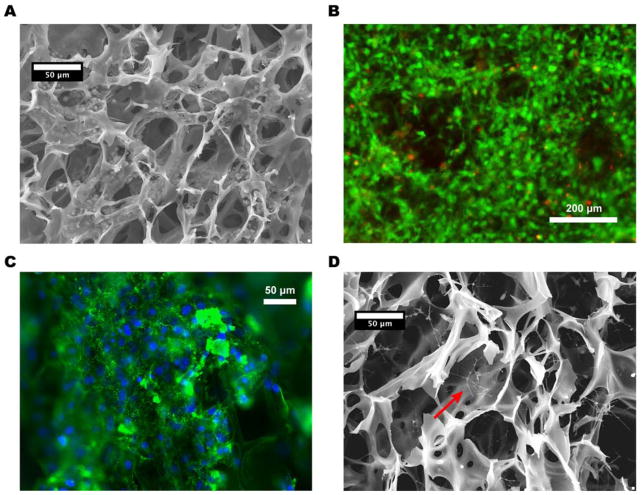
Figure 3.
A) SEM micrograph of PEDOT:PSS scaffold after 24 hours of cell culture, showing invasion of the scaffold by 3T3-L1s. B) Fluorescence micrograph of a PEDOT:PSS scaffold after 7 days of 3T3-L1 culture, showing very high cell viability. Live cells are stained with calcein (green), and dead cells are stained with propidium iodide (red). The pores of the scaffold are visible as large circular dark regions. C) Fluorescence micrograph of a PEDOT:PSS scaffold, with cell-deposited fibronectin fibers (green) after 24 hours of 3T3-L1 culture. Cell nuclei are stained with DAPI (blue). d) SEM image of a decellularized scaffold, clearly showing protein fibers produced by 3T3-L1 cells during 24 hours of culture.

