
Fig. 1.
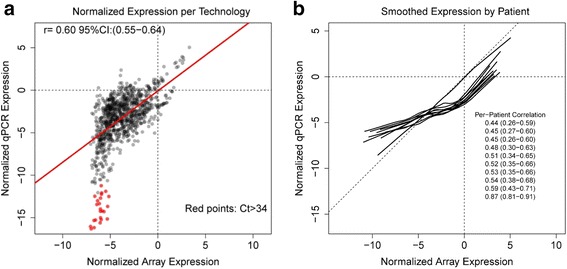
Correlation of gene expression of 91 genes from 10 snap-frozen TCGA samples measured with Affymetrix U133 microarray (X-axis) and, in the current study, with TaqMan qPCR (Y-axis). The 91 probes from the 10 samples were each normalized to the average of three housekeeping genes (GUSB, GAPDH, and HPRT1). a The scatterplot shows that gene-to-gene expression has similar ranges across both technologies when normalized to the same three-gene average (r = 0.60). b Lowess smoothing curves. Red dots signify Ct values >34 which are not included in final index measurements