
Fig. 2.
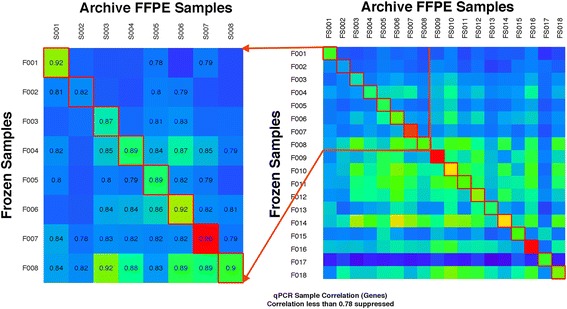
Correlation of gene expression from 18 matched serous ovarian cancer samples. F-labeled samples represent snap-frozen tissue; S represents each patient’s matched FFPE tissue block. All samples were obtained from an initial surgical procedure, and gene outputs were measured with qPCR. Blue represents lower correlation, red higher. An expansion of samples 001 through 008 with absolute level of correlation is provided. Levels of correlation <0.79 are not displayed