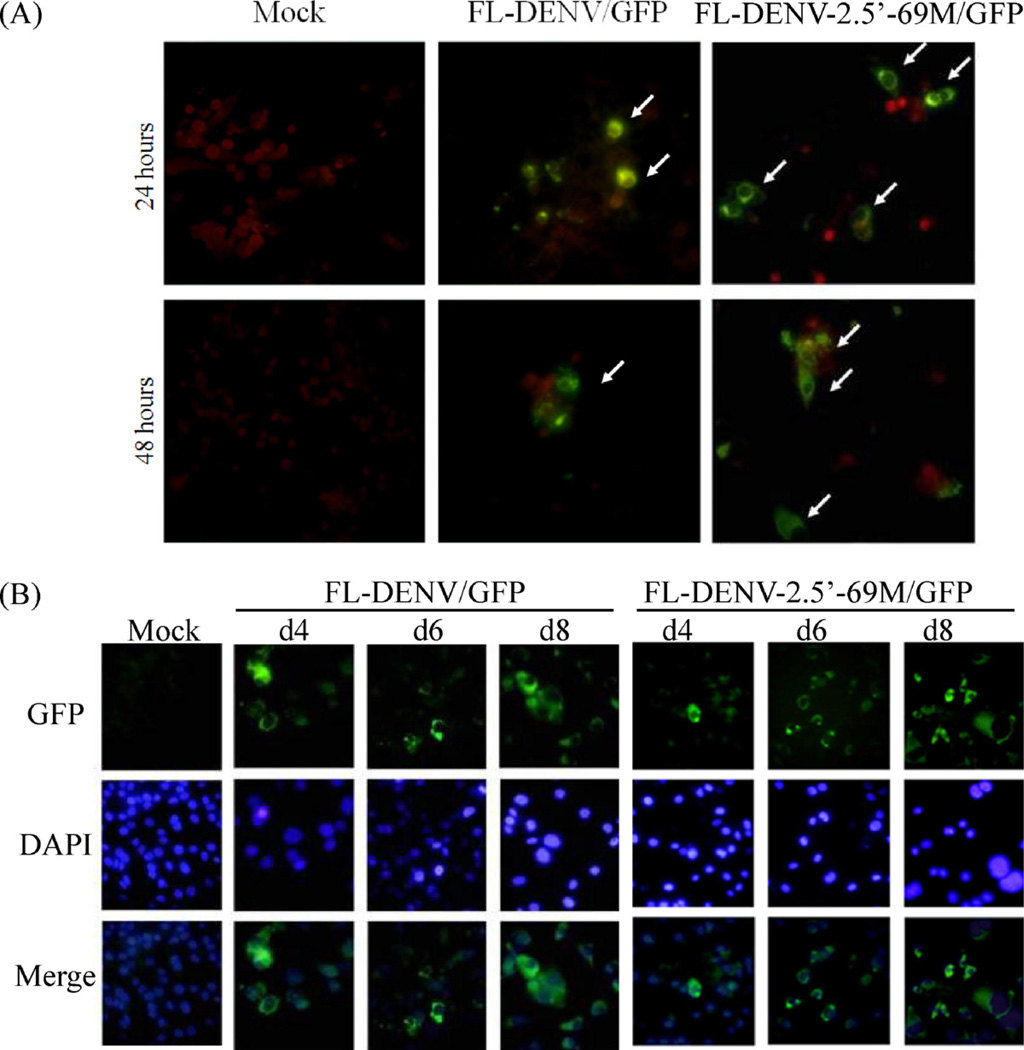
Fig. 2.
Fluorescent images of cells transfected with the FL-DENV/GFP RNA or FL-DENV-2.5′-69M/GFP RNA. (A) IFA images showing expression of viral protein in transfected cells at 24 and 48 h pt. Green cells (arrows) indicate positive cells, and red cells represent negative cells counter stained with Evans blue. (B) Green fluorescence emitted by GFP in the transfected cells on days 4, 6 and 8 pt. The cells were nuclear stained with DAPI (blue color). The micrographs were taken at 400× magnification. (For interpretation of the references to color in this figure legend, the reader is referred to the web version of the article.)

