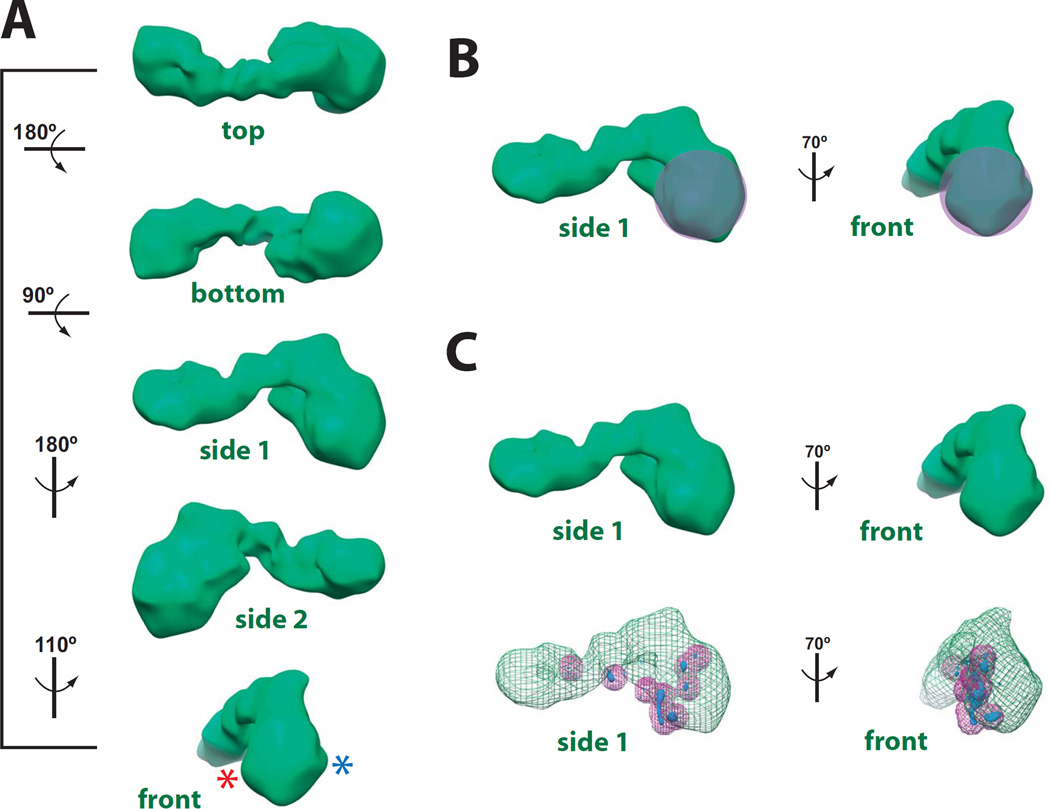
Fig. 3.
Three-dimensional structure and pol II docking results for the activator-free Mediator–pol II–TFIIF assembly. (A) Different views of the cryo-EM reconstruction, rendered to 1.8 MDa. Rotation of the structure shown at left. The resolution of this structure is 32 Å, based upon both the Fourier Shell Correlation (0.5 cutoff) and the half-bit threshold.54,55 Asterisks for the “front” view represent sites where the pol II stalk protrudes from the structure, based upon 1) extra protein density observed at higher mass thresholds (not shown), and 2) the top pol II docking results based upon cross-correlation coefficients with 8 different pol II crystal structures (see Supplemental Table 1). The absence of clear pol II stalk density at 1.8MDa rendering is consistent with multiple pol II orientations within the sample (see text). The cryo-EM map has been deposited in the EM Databank (http://www.ebi.ac.uk/pdbe/emdb/), entry number 5344.(B) General location of pol II, based upon the docking experiments. (C) The 3D variance map for Mediator–pol II–TFIIF. The variance map is displayed in blue and superimposed upon the Mediator–pol II–TFIIF cryo-EM map, which is shown in green mesh. To enhance visualization, peaks in the 3D variance map are also marked with purple spheres with a radius of 5 pixels (21 Å).

