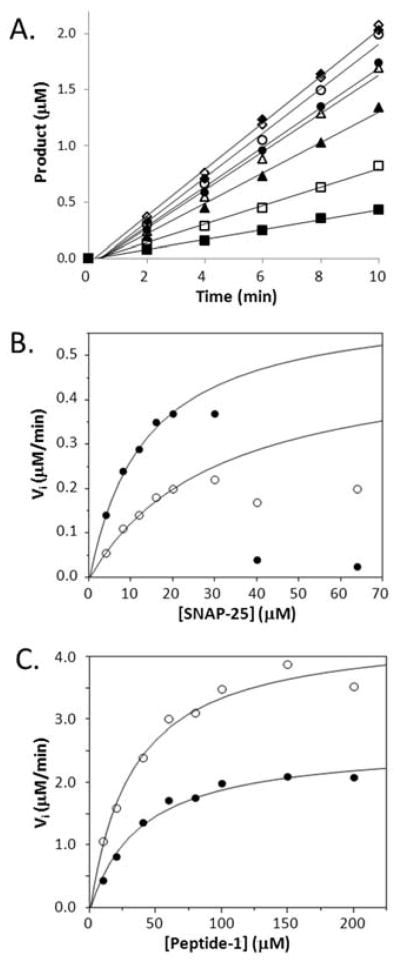
Figure 2.
A. A typical time-course plots for a set of BoNT/A5 catalyzed hydrolysis of Peptide-1 with various starting concentration of the substrate: 10 (■), 20 (□), 40 (▼), 60 (▽), 80 (●), 100 (○), 150 (◆) or 200 (◇) mM. B. and C. The plots of the reaction velocities as a function of the substrate concentration, measured as the slopes of the lines from the time-courses of the hydrolysis of SNAP-25 and the Peptide-1 cleaved by BoNT/A1 (○) or /A5 (●).

