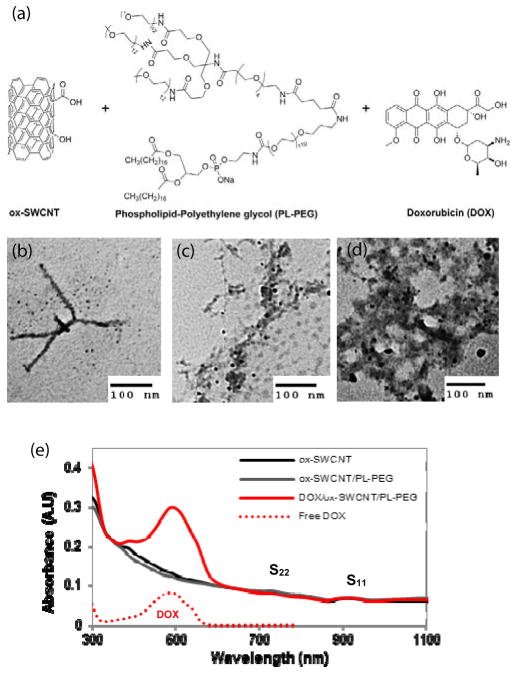
Fig.1.
(a) Chemical structures of the individual components, (b)–(d) TEM images of (b) oxidized HiPco (ox-SWCNT), (c) after functionalization with PL-PEG (ox-SWCNT/PL-PEG), and (d) loading with DOX/ox-SWCNT/PL-PEG (DOX-SWCNT). (e) UV-Vis-NIR absorption spectra for each functional nanomaterial. The spectra for SWCNT samples were normalized at 364 nm for comparison.

