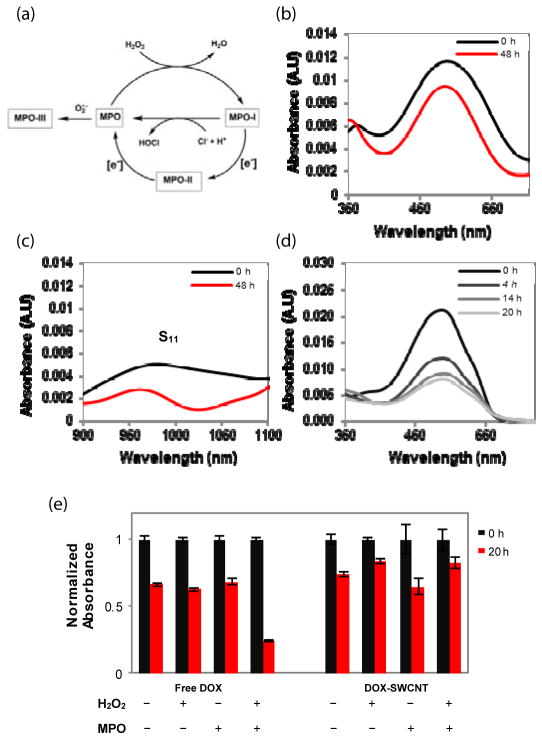
Fig. 2.
MPO-catalysed oxidative degradation under pH 7.4 at 37 °C. (a) MPO catalytic cycle activated by H2O2 and production of HOCl. (b) Change in DOX absorbance (495 nm) and (c) S11 band (900–1100 nm) before and after 48 h. (d) Decreasing absorbance of free DOX over 20 h. (e) Degradation of DOX (free DOX vs. DOX-SWCNT) under four different conditions of (±) MPO/(±) H2O2. The error bars indicate the means ± SD of three replicate measurements.

