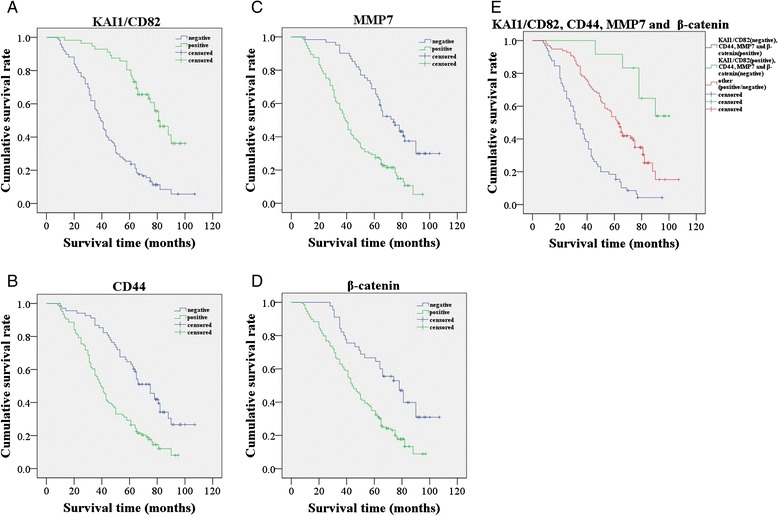
Fig. 2.

Kaplan–Meier analysis of the survival rate of patients with colorectal carcinoma. a Overall survival of all patients in relation to KAI1/CD82 expression (log-rank =46.961, P < 0.001). b Overall survival of all patients in relation to CD44 expression (log-rank = 24.611, P < 0.001). c Overall survival of all patients in relation to MMP7 expression (log-rank = 27.764, P < 0.001). D Overall survival of all patients in relation to β-catenin expression (log-rank = 15.756, P < 0.001). In a, b, c and d analyses, the green line represents positive expression of proteins and the blue line represents negative expression of proteins. e Overall survival of all patients in relation to the combination of KAI1/CD82, CD44, MMP7 and β-catenin expression (log-rank = 52.882, P < 0.001). The green line represents positive expression of KAI1/CD82 and negative expression of CD44, MMP7, β-catenin and the blue line represents negative expression of KAI1/CD82 and positive expression of CD44, MMP7, β-catenin. The red line represents other positive or negative expression of the proteins. In all analyses, ┼ represents censored observation
