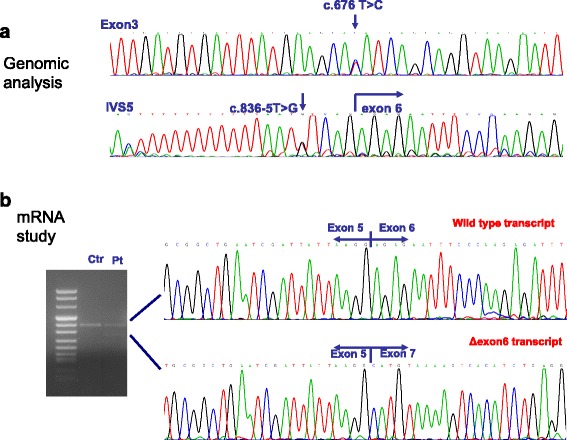
Fig. 3.

ISPD molecular analysis. a Electropherograms depicting the missense mutation c.676 T > C and the intronic substitution c.836-5 T > G. b mRNA analysis reveals the production of two different transcripts: the wild-type transcript, and a shorter transcript that corresponds to an isoform with a lower molecular weight. cDNA cloning demonstrated that the latter isoform corresponds to an isoform lacking exon 6
