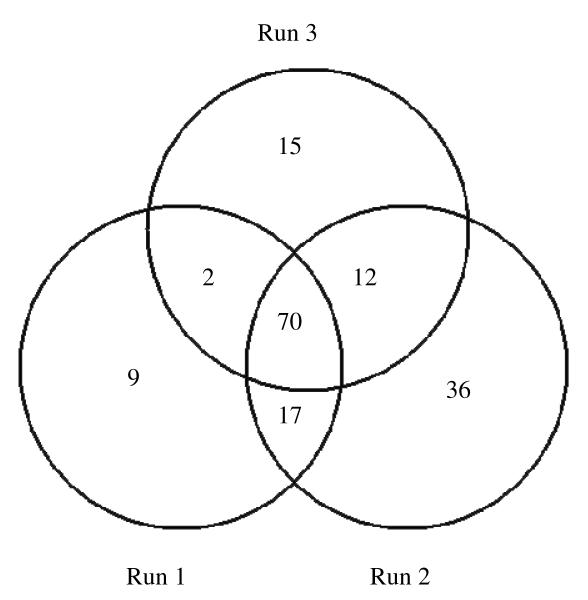
Figure 1.
Venn diagram showing the number of proteins identified in three runs RP-LC-MS/MS analyses of the OGE separated peptides. Each number with no overlap of circles shows the number of proteins uniquely seen in that run, while overlapping circles show the numbers of identifed proteins common to 2 or to 3 of the analyses.

