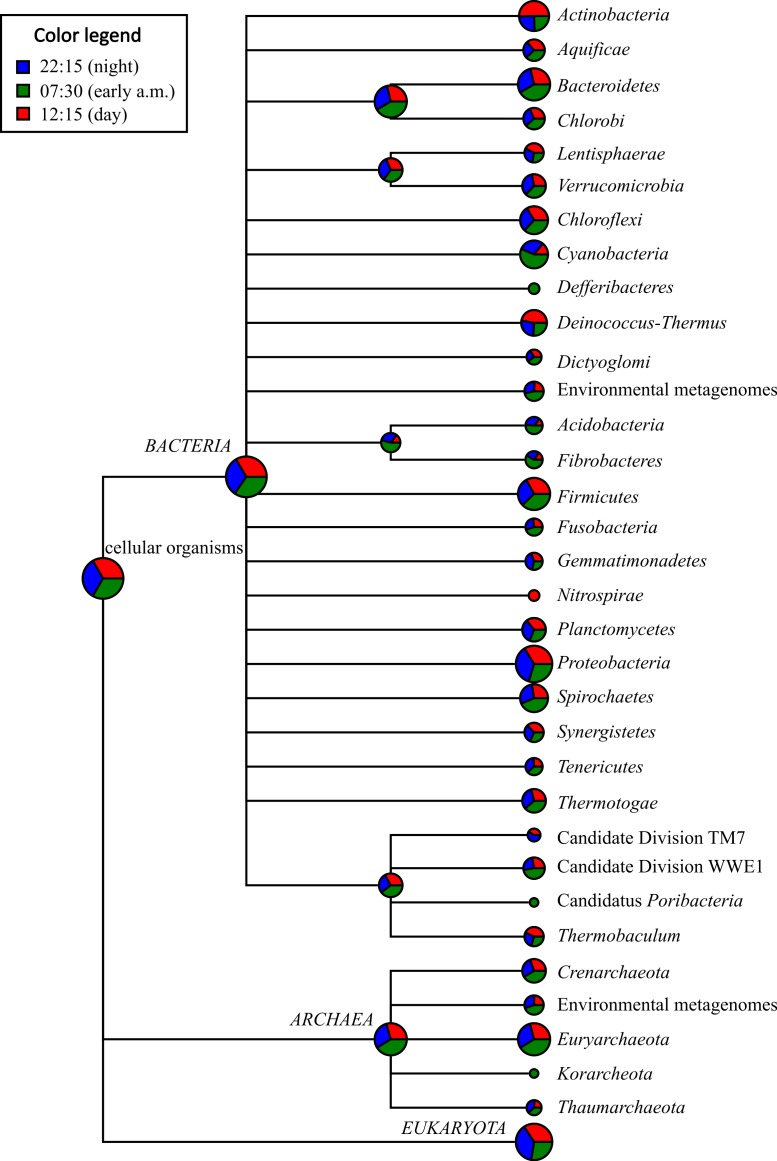
Figure 2. Taxonomic distribution of bacterial and archaeal mRNA transcripts in Zodletone sediment samples.
Values are based on relative abundance of transcripts associated with each phylum, as determined using MEGAN 4.0, at three different time points: 22:15 (n = 34,835 reads), 07:30 (n = 53,381 reads), and 12:15 (n = 35,643 reads). Pie chart sizes are proportional to the overall relative abundance of each taxon. Relative abundance values representing the proportion of potential mRNA transcripts that yielded no significant BLASTX alignments for each time point are not shown. Specific relative abundance values for mRNA transcripts mapping to different taxa at the phylum-, class-, and order-levels are reported for each sample in Table S3.

