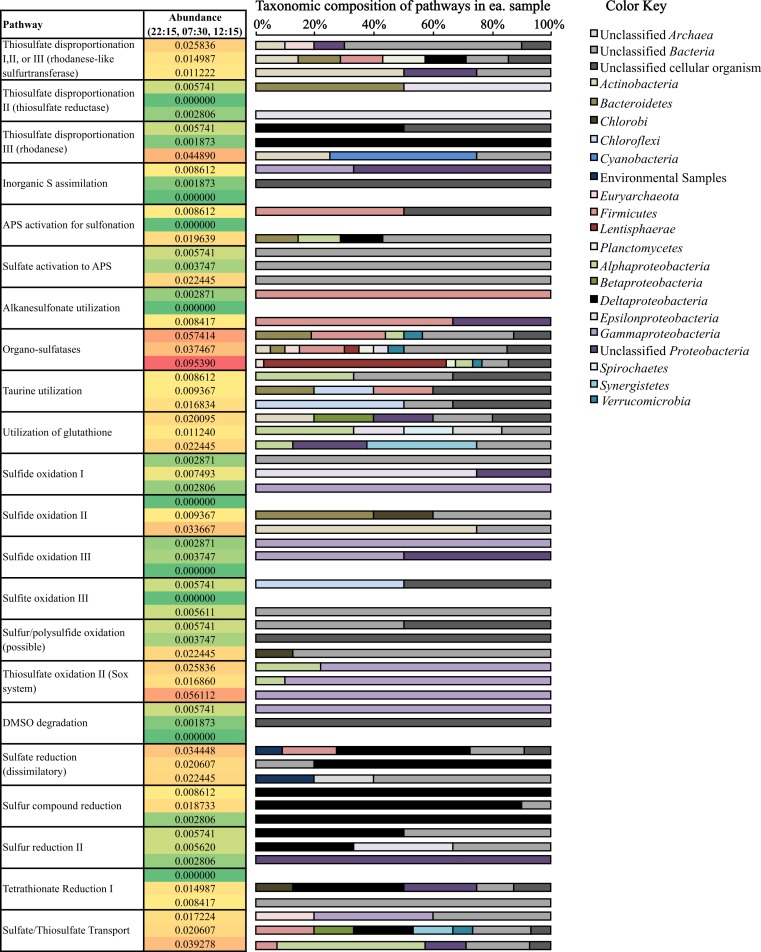
Figure 5. Relative abundance and taxonomic composition of sulfur cycling transcripts.
Rel. abundance values shown are the % of total potential mRNA transcripts from each sample, 22:15 (top of ea. box). 07:30 (middle), and 12:15 (bottom). The color scale ranks each gene from least abundant (green) to most abundant (red). A full list of gene names categorized in each pathway can be found below Table 2.

