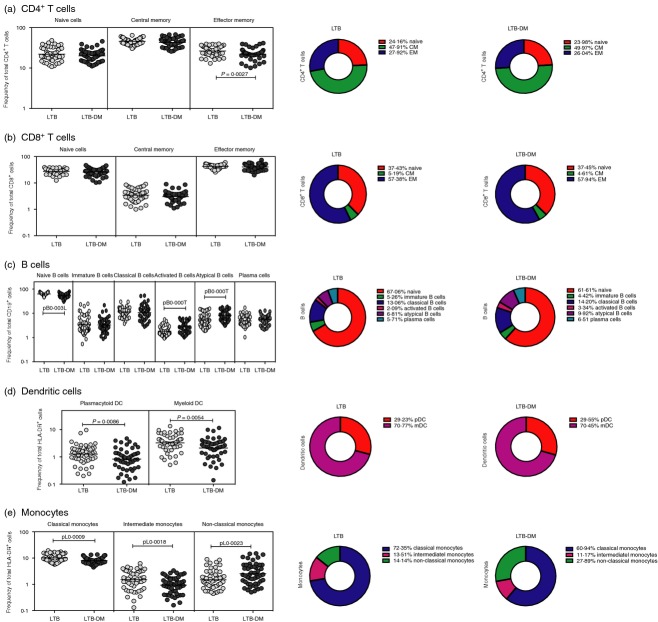
Figure 3.
Latent tuberculosis–diabetes mellitus (LTB-DM) co-morbidity is associated with altered frequency (Fo) of T-cell, B-cell, dendritic cell (DC) and monocyte subsets. (a) Fo of CD4+ T-cell (b); CD8+ T-cell; (c) B-cell; (d) DC and (e) monocyte subsets in LTB-DM (n = 50) and LTB (n = 50) individuals. The data are represented as scatter plots with each circle representing a single individual. P values were calculated using the Mann–Whitney U-test. The pie charts depict the geometric mean Fo of the individual subset of leucocytes in the two groups.

