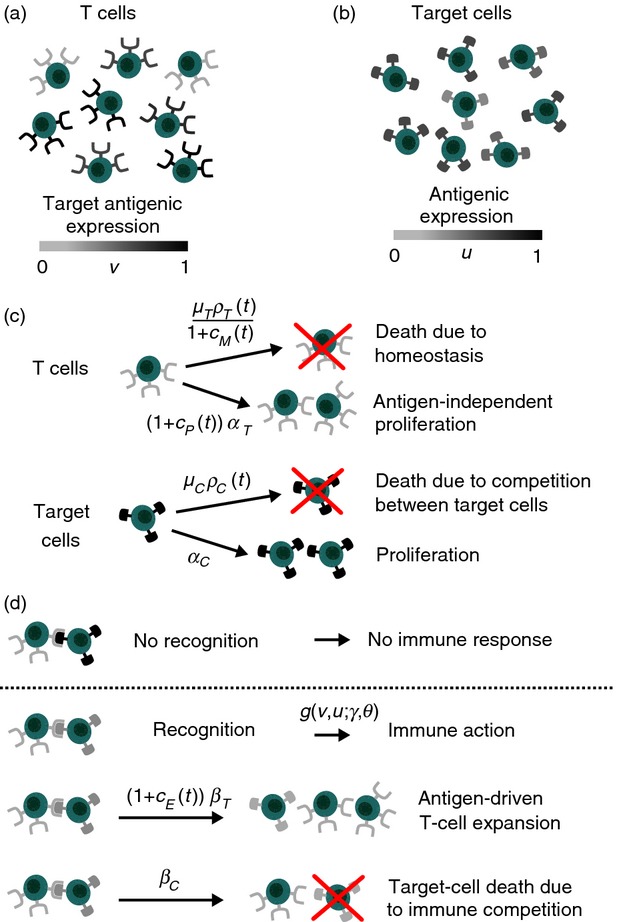
Figure 2.

Structure of the mathematical model. (a) The target antigenic expression that characterizes each T cell (v) is represented by the colour of the receptors on its surface. (b) Likewise, the antigenic expression that characterizes each target cell (u) is represented by the colour of the antigens on its surface. (c) T cells undergo antigen-independent proliferation at a rate αT and die due to homeostatic pressure at a rate μT ρT(t), while target cells proliferate at a rate αC and die due to competition with other target cells at a rate μC ρC(t). (d) T cells recognize a target cell at rate g if their target antigenic expression is similar enough to the antigenic expression of the target cell (i.e. when the colours of receptors and the colour of antigens match). When this occurs, an immune response is initiated: T-cell expansion occurs at a rate βT and the immune system attacks target cells so that they are killed at a rate βC. The factors [1+cE(t)], [1+cP(t)] and 1/[1+cM(t)] mimic, respectively, the stimulation of antigen-driven expansion by E-agents, the enhancement of antigen-independent proliferation mediated by P-agents, and the promotion of self-renewal due to M-agents.
