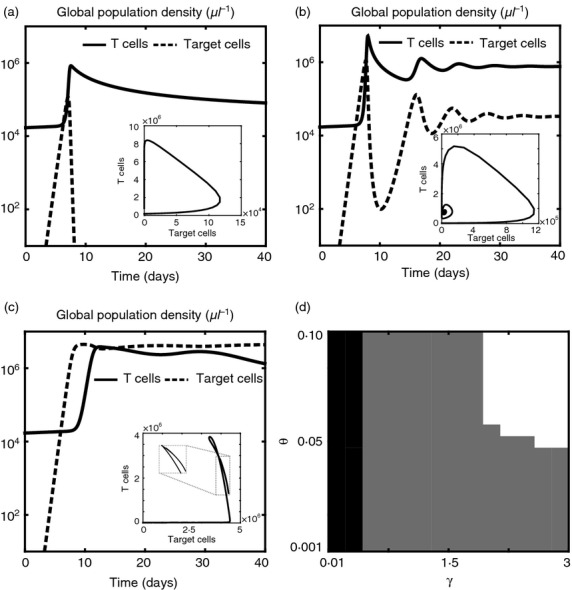
Figure 3.

The model reproduces a range of observed behaviours of the adaptive immune response. (a–c) Sample dynamics of the global population densities of T cells (solid lines) and target cells (dashed lines), in the absence of therapeutic agents, for different values of the maximum affinity γ and the average affinity range of T-cell receptors θ. In all cases, the early dynamics of the global population densities resemble those that are usually observed during acute infection, with exponential growth of target cells and consequent expansion of T cells until target cells begin to decay. When both γ and θ are large (a), early clearance occurs. For intermediate values of γ and θ (b), the global population densities of T cells and target cells oscillate until they converge to a state of chronic infection, with a smaller number of target cells being kept under control by a larger number of T cells. When both γ and θ are low (c), early immune escape takes place, and the population of target cells keeps expanding until saturation. Insets of (a–c): corresponding trajectories in the (ρC,ρT) plane. (d) Phase diagram showing the regions of the (γ,θ) plane corresponding to early clearance (white), chronic infection (grey) and early escape (black). Although the specific boundaries of these regions can vary according to the values of the other parameters of the model, the trends of the global population densities of T cells and target cells in the case of early clearance, chronic infection and early escape remain qualitatively similar to those shown in (a–c).
