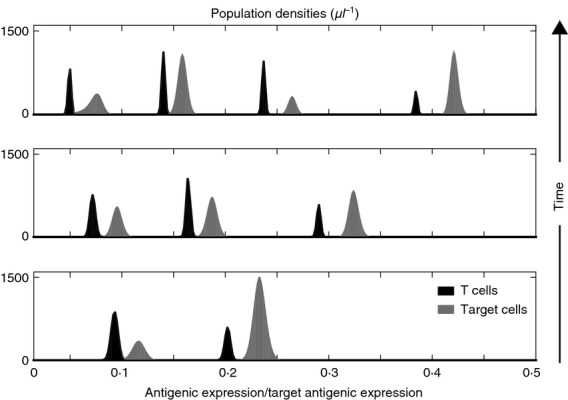
Figure 4.

‘Chase-and-escape’ dynamics of antigen-specific T cells and target cells during chronic infection. Population densities of T cells (black) and target cells (grey) at t = 130 days (bottom panel), t = 400 days (central panel) and t = 1000 days (top panel), in the absence of therapeutic agents, for a choice of the maximum affinity γ and the average affinity range of T-cell receptors θ corresponding to chronic infection.
