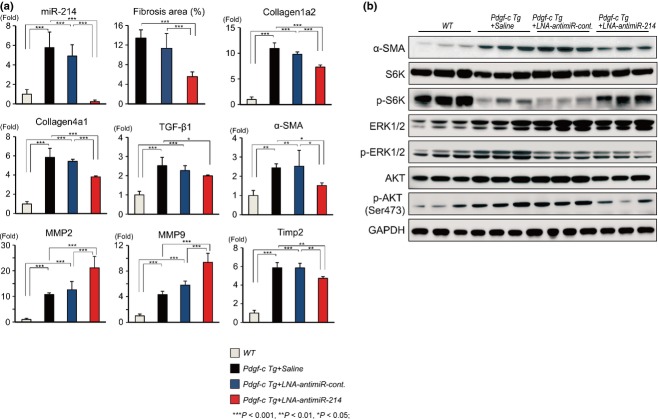
Figure 4.
Quantitative evaluation of the expression of pro-fibrotic genes using TaqMan real-time detection-PCR (RTD-PCR) and western blotting. (a) Quantitative analysis of the expression of pro-fibrotic genes using TaqMan RTD-PCR. Fibrotic areas in mouse liver were measured semi-quantitatively by densitometry analysis (n = 6 each). (b) Western blotting analysis of the expression of pro-fibrotic genes (α-SMA, ERK 1/2, p-ERK 1/2, AKT and p-AKT) and protein synthesis (S6K and p-S6K).

