Figure 1.

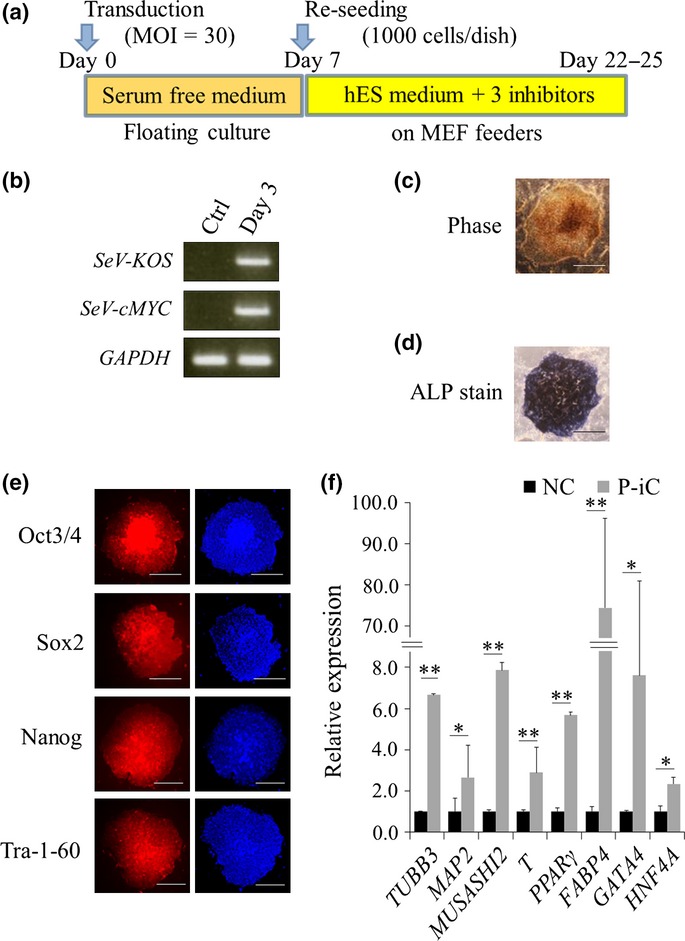
Induction of pluripotent cancer cells from PANC-1 cells. (a) Schematic representation of the reprogramming protocol. (b) RT-PCR analysis of transgenes for reprogramming. (c) Representative image of induced pluripotent stem (iPS)-like colonies. Phase, phase contrast. Bar = 500 μm. (d) Representative image of alkaline phosphatase (ALP)-positive colonies. Bar = 500 μm. (e) Immunofluorescence staining of ES cell markers in reprogrammed colonies. Right panels, Hoechst33342. (f) qRT-PCR of differentiation markers. n = 3. Data are represented as the mean ± SD and were analyzed by two-tailed unpaired t-tests. (*P<0.05, **P<0.01, P-iC vs. NC), P-iC, Post-iPC; NC, Negative control.Bar = 500 μm. ALP, alkaline phosphatase; Ctrl, control; Day 3, post-transduced PANC-1 cells on day 3; iPS, induced pluripotent stem; SeV-cMYC, Sendai virus carrying cMYC; SeV-KOS, Sendai virus carrying polycistronic transgenes KLF4-OCT3/4-SOX2.
