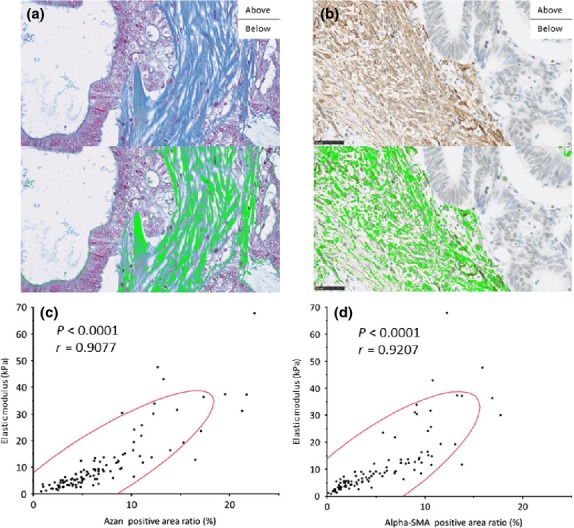
Figure 2.

The correlation between the elastic modulus (EM) of cancer tissue and morphometric factors. The Azan positive area was determined as the visualized area stained with aniline blue (a-above) and identified as bright green in this image by using the color-detecting algorithm of the software (a-below). The α-SMA positive area (b-above) was identified as bright green using the color-detecting algorithm of the software (b-below). (c) There was a strong correlation with the EM of colorectal cancer tissue and the Azan positive area (P < 0.0001; r = 0.9077). (d) There was also a strong correlation with the EM of colorectal cancer tissue and the α-SMA positive area (P < 0.0001; r = 0.9207).
