Figure 4.

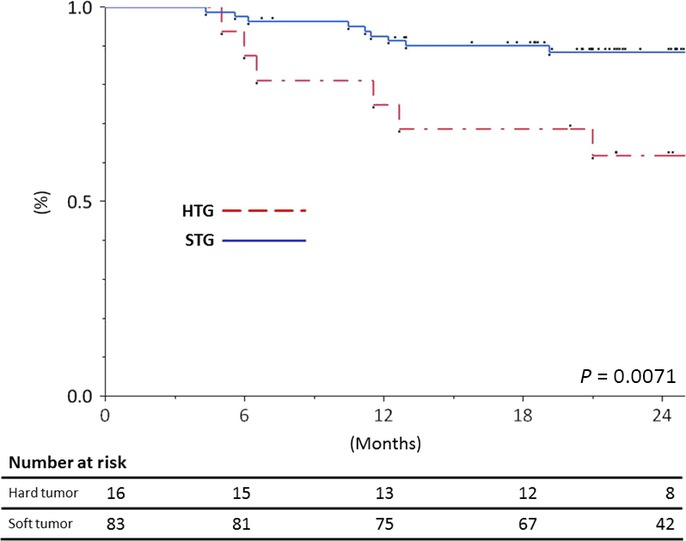
Kaplan–Meier curves for for disease-free survival (DFS) according to the hard tumor group (n = 16) and soft tumor group (n = 83). The DFS of the hard tumor group was shorter than that seen in the soft tumor group (P = 0.0071).

Kaplan–Meier curves for for disease-free survival (DFS) according to the hard tumor group (n = 16) and soft tumor group (n = 83). The DFS of the hard tumor group was shorter than that seen in the soft tumor group (P = 0.0071).