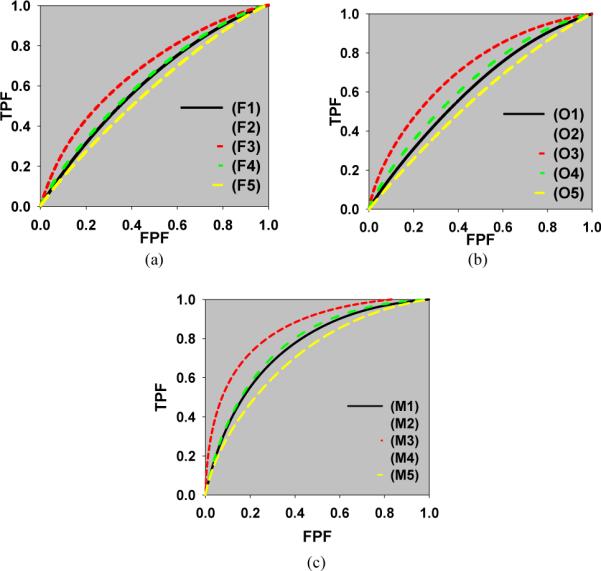
FIGURE 7.

Averaged ROC curves for each method. ((a) 3D FBP followed by 3D spatial + 1D post-temporal filtering, (b) 3D OS-EM with ADS correction followed by 3D spatial + 1D post-temporal filtering, (c) 4D MAP-RBI-EM with ADS correction. (The legends (F1) through (M5) are the same to those in Table 2)
